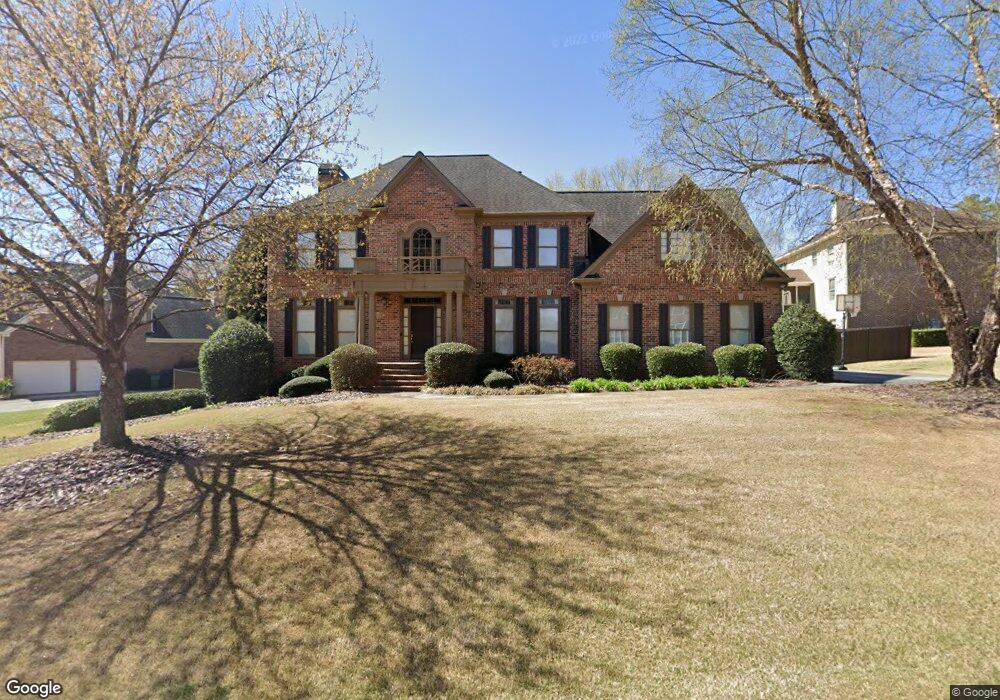
5795 Culler Ct Unit IVC Alpharetta, GA 30005
Seven Oaks NeighborhoodEstimated Value: $736,000 - $870,000
4
Beds
4
Baths
2,804
Sq Ft
$284/Sq Ft
Est. Value
About This Home
This home is located at 5795 Culler Ct Unit IVC, Alpharetta, GA 30005 and is currently estimated at $797,010, approximately $284 per square foot. 5795 Culler Ct Unit IVC is a home located in Fulton County with nearby schools including Taylor Road Middle School, Chattahoochee High School, and Cresco Montessori School - Johns Creek Campus.
Ownership History
Date
Name
Owned For
Owner Type
Purchase Details
Closed on
Nov 23, 2011
Sold by
Johnson Eddie L
Bought by
Brooms-Johnson Treza L
Current Estimated Value
Home Financials for this Owner
Home Financials are based on the most recent Mortgage that was taken out on this home.
Original Mortgage
$320,000
Outstanding Balance
$219,574
Interest Rate
4.15%
Mortgage Type
New Conventional
Estimated Equity
$577,436
Purchase Details
Closed on
Feb 26, 1999
Sold by
John Wieland Homes Inc
Bought by
Johnson Treza L and Johnson Eddie L
Home Financials for this Owner
Home Financials are based on the most recent Mortgage that was taken out on this home.
Original Mortgage
$237,600
Interest Rate
6.79%
Mortgage Type
New Conventional
Create a Home Valuation Report for This Property
The Home Valuation Report is an in-depth analysis detailing your home's value as well as a comparison with similar homes in the area
Home Values in the Area
Average Home Value in this Area
Purchase History
| Date | Buyer | Sale Price | Title Company |
|---|---|---|---|
| Brooms-Johnson Treza L | -- | -- | |
| Johnson Treza L | $297,000 | -- |
Source: Public Records
Mortgage History
| Date | Status | Borrower | Loan Amount |
|---|---|---|---|
| Open | Brooms-Johnson Treza L | $320,000 | |
| Previous Owner | Johnson Treza L | $237,600 |
Source: Public Records
Tax History Compared to Growth
Tax History
| Year | Tax Paid | Tax Assessment Tax Assessment Total Assessment is a certain percentage of the fair market value that is determined by local assessors to be the total taxable value of land and additions on the property. | Land | Improvement |
|---|---|---|---|---|
| 2025 | $7,268 | $373,360 | $85,280 | $288,080 |
| 2023 | $8,730 | $309,280 | $86,320 | $222,960 |
| 2022 | $7,535 | $245,560 | $43,320 | $202,240 |
| 2021 | $6,146 | $195,080 | $45,120 | $149,960 |
| 2020 | $7,033 | $218,480 | $37,840 | $180,640 |
| 2019 | $846 | $214,600 | $37,160 | $177,440 |
| 2018 | $6,826 | $209,600 | $36,320 | $173,280 |
| 2017 | $6,693 | $196,640 | $33,920 | $162,720 |
| 2016 | $6,596 | $196,640 | $33,920 | $162,720 |
| 2015 | $6,920 | $204,040 | $33,920 | $170,120 |
| 2014 | $5,754 | $163,160 | $27,120 | $136,040 |
Source: Public Records
Map
Nearby Homes
- 585 Meadows Creek Dr
- 11915 Carriage Park Ln
- 7335 Lytham Trace
- 11800 Carriage Park Ln
- 110 W Meadows Ct
- 230 Sessingham Ln
- 5785 Oxborough Way Unit 1
- 7105 Brookwood Way
- 11420 Crossington Rd
- 7530 Sherringate Dr
- 3250 Lakeheath Dr
- 5650 Preserve Cir
- 775 Ellsborough Ct
- 5530 Preserve Cir
- 5105 Deerlake Dr
- 5575 Ashwind Trace
- 0 Culler Ct Unit 8345283
- 0 Culler Ct Unit 7208661
- 0 Culler Ct
- 5805 Culler Ct Unit IVC
- 700 Quail Run Ct
- 710 Quail Run Ct Unit 4B
- 0 Quail Run Ct Unit 3176333
- 0 Quail Run Ct Unit 8149288
- 0 Quail Run Ct
- 5790 Culler Ct
- 5780 Culler Ct
- 5800 Culler Ct
- 5770 Culler Ct Unit 4C
- 5815 Culler Ct
- 5810 Culler Ct Unit C
- 5760 Culler Ct Unit B
- 705 Quail Run Ct
- 715 Quail Run Ct
- 225 Colton Crest Dr
- 725 Quail Run Ct Unit 4B