Estimated Value: $284,819 - $381,000
4
Beds
3
Baths
2,932
Sq Ft
$111/Sq Ft
Est. Value
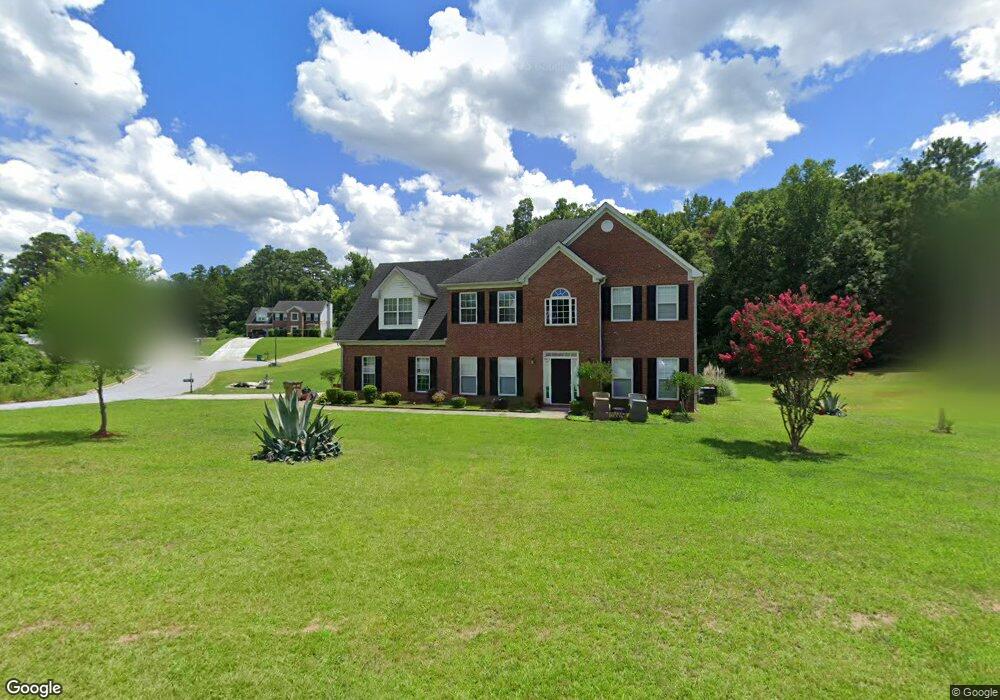
About This Home
This home is located at 5795 Goldleaf Way, Rex, GA 30273 and is currently estimated at $325,705, approximately $111 per square foot. 5795 Goldleaf Way is a home located in Clayton County with nearby schools including Roberta T. Smith Elementary School, Adamson Middle School, and Morrow High School.
Ownership History
Date
Name
Owned For
Owner Type
Purchase Details
Closed on
Jun 23, 2017
Bought by
Kahdeidra Ponder
Current Estimated Value
Home Financials for this Owner
Home Financials are based on the most recent Mortgage that was taken out on this home.
Original Mortgage
$191,369
Outstanding Balance
$162,038
Interest Rate
4.87%
Mortgage Type
FHA
Estimated Equity
$163,667
Purchase Details
Closed on
Mar 6, 2017
Bought by
Lhp Investments Inc
Purchase Details
Closed on
Jul 5, 2016
Sold by
Cassy
Bought by
The Bank Of New York Mel
Purchase Details
Closed on
Jun 4, 2004
Sold by
M & M Custom Homes Inc
Bought by
Grant Cassie
Home Financials for this Owner
Home Financials are based on the most recent Mortgage that was taken out on this home.
Original Mortgage
$186,900
Interest Rate
6.25%
Mortgage Type
New Conventional
Create a Home Valuation Report for This Property
The Home Valuation Report is an in-depth analysis detailing your home's value as well as a comparison with similar homes in the area
Home Values in the Area
Average Home Value in this Area
Purchase History
| Date | Buyer | Sale Price | Title Company |
|---|---|---|---|
| Kahdeidra Ponder | $194,900 | -- | |
| Lhp Investments Inc | $125,000 | -- | |
| The Bank Of New York Mel | $138,550 | -- | |
| Grant Cassie | $207,700 | -- |
Source: Public Records
Mortgage History
| Date | Status | Borrower | Loan Amount |
|---|---|---|---|
| Open | Kahdeidra Ponder | $191,369 | |
| Previous Owner | Grant Cassie | $186,900 |
Source: Public Records
Tax History
| Year | Tax Paid | Tax Assessment Tax Assessment Total Assessment is a certain percentage of the fair market value that is determined by local assessors to be the total taxable value of land and additions on the property. | Land | Improvement |
|---|---|---|---|---|
| 2025 | $3,509 | $100,640 | $9,600 | $91,040 |
| 2024 | $3,615 | $101,680 | $9,600 | $92,080 |
| 2023 | $3,671 | $101,680 | $9,600 | $92,080 |
| 2022 | $3,496 | $98,120 | $9,600 | $88,520 |
| 2021 | $3,057 | $86,440 | $9,600 | $76,840 |
| 2020 | $2,822 | $79,600 | $9,600 | $70,000 |
| 2019 | $3,047 | $84,116 | $9,600 | $74,516 |
| 2018 | $2,453 | $69,479 | $8,482 | $60,997 |
| 2017 | $2,866 | $69,510 | $9,600 | $59,910 |
| 2016 | $2,544 | $61,594 | $9,600 | $51,994 |
| 2015 | $38 | $0 | $0 | $0 |
| 2014 | $50 | $50,400 | $14,400 | $36,000 |
Source: Public Records
Map
Nearby Homes
- 5679 Jubilant Dr
- 176 Stokes Dr
- 232 Clarkdell Dr
- 7001 Coatsworth Dr Unit LOT 1
- 2132 E Atlanta Rd
- 5847 Pinetree Ln
- 51 Ac Rex Rd
- 4609 Rex Rd
- 5747 Rex Mill Creek
- 245 Remington Trail
- 3836 Rex Cir
- 3821 Rex Mill Square
- 6132 Christopher Terrace Unit 3
- 260 Remington Trail Unit 2
- 6320 Headwaters Way
- 51 AC Rex Rd
- 1773 E Atlanta Rd
- 3839 Teton Pass
- 3777 Teton Pass
- 350 Roundup Trail
- 5799 Goldleaf Way
- 4317 Joyous View
- 5807 Goldleaf Way
- 5806 Goldleaf Way
- 5800 Goldleaf Way
- 4318 Joyous View
- 4313 Joyous View
- 4326 Joyous View
- 5787 Wilkerson Rd
- 5841 Wilkerson Rd
- 5875 Gretna Ct
- 5779 Wilkerson Rd
- 4293 Goldleaf Terrace
- 5770 Goldleaf Way
- 5759 Goldleaf Way
- 5886 Gretna Ct
- 4285 Goldleaf Terrace
- 4314 Joyous View
- 5767 Wilkerson Rd
- 5861 Wilkerson Rd
Your Personal Tour Guide
Ask me questions while you tour the home.