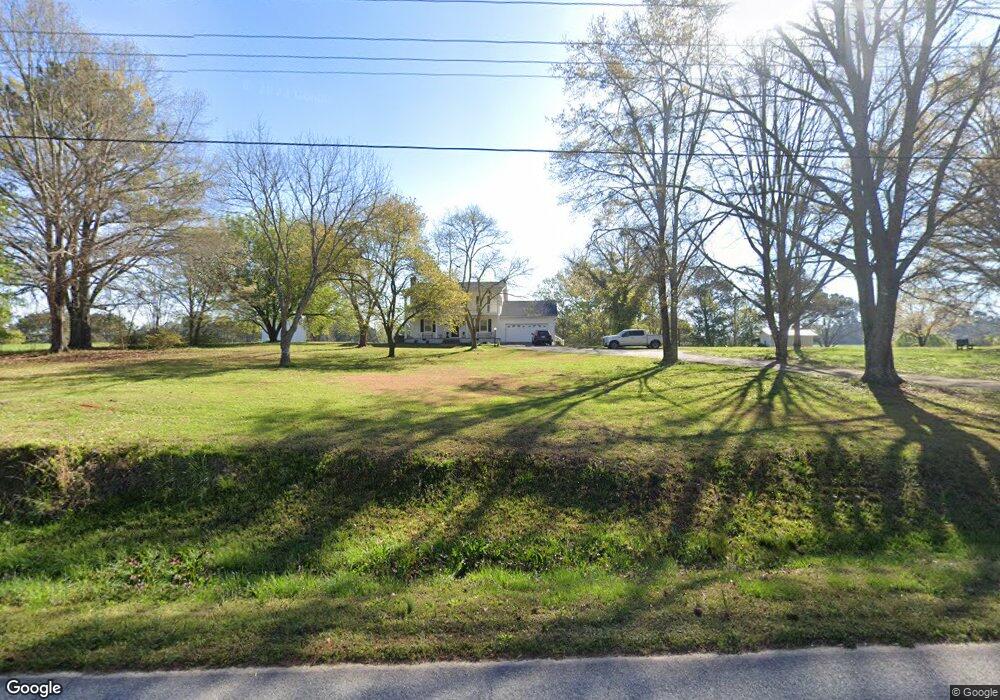
5795 Red Land Rd Franklin, GA 30217
Estimated Value: $221,382 - $582,000
2
Beds
1
Bath
886
Sq Ft
$420/Sq Ft
Est. Value
About This Home
This home is located at 5795 Red Land Rd, Franklin, GA 30217 and is currently estimated at $372,346, approximately $420 per square foot. 5795 Red Land Rd is a home located in Heard County with nearby schools including Heard County High School.
Ownership History
Date
Name
Owned For
Owner Type
Purchase Details
Closed on
Apr 18, 2014
Sold by
Carmical R Scott
Bought by
Mcwilliams Richard C and Mcwilliams Kristin H
Current Estimated Value
Home Financials for this Owner
Home Financials are based on the most recent Mortgage that was taken out on this home.
Original Mortgage
$116,000
Outstanding Balance
$88,281
Interest Rate
4.37%
Mortgage Type
New Conventional
Estimated Equity
$284,065
Purchase Details
Closed on
Jul 30, 2008
Sold by
Rande Louise Mickle
Bought by
Carmical R Scott and Carmical Susan L
Purchase Details
Closed on
Mar 15, 1978
Sold by
Rande Clarance T
Bought by
Rande Louise M
Purchase Details
Closed on
Jan 1, 1901
Bought by
Rande Clarance T
Create a Home Valuation Report for This Property
The Home Valuation Report is an in-depth analysis detailing your home's value as well as a comparison with similar homes in the area
Home Values in the Area
Average Home Value in this Area
Purchase History
| Date | Buyer | Sale Price | Title Company |
|---|---|---|---|
| Mcwilliams Richard C | $145,000 | -- | |
| Carmical R Scott | $149,500 | -- | |
| Rande Louise M | -- | -- | |
| Rande Clarance T | -- | -- |
Source: Public Records
Mortgage History
| Date | Status | Borrower | Loan Amount |
|---|---|---|---|
| Open | Mcwilliams Richard C | $116,000 |
Source: Public Records
Tax History Compared to Growth
Tax History
| Year | Tax Paid | Tax Assessment Tax Assessment Total Assessment is a certain percentage of the fair market value that is determined by local assessors to be the total taxable value of land and additions on the property. | Land | Improvement |
|---|---|---|---|---|
| 2024 | $573 | $69,443 | $54,009 | $15,434 |
| 2023 | $564 | $48,637 | $32,964 | $15,673 |
| 2022 | $535 | $47,473 | $32,964 | $14,509 |
| 2021 | $502 | $44,926 | $32,964 | $11,962 |
| 2020 | $1,163 | $45,444 | $32,964 | $12,480 |
| 2019 | $1,164 | $52,418 | $39,938 | $12,480 |
| 2018 | $1,186 | $52,418 | $39,938 | $12,480 |
| 2017 | $333 | $42,694 | $36,214 | $6,480 |
| 2016 | $328 | $42,694 | $36,214 | $6,480 |
| 2015 | -- | $45,197 | $39,709 | $5,488 |
| 2014 | -- | $41,234 | $39,709 | $1,525 |
| 2013 | -- | $41,640 | $39,709 | $1,931 |
Source: Public Records
Map
Nearby Homes
- 4383 Ga Highway 34
- 4383 Georgia 34
- 6110 Ga Highway 34
- 6215 Georgia 34
- 1555 Straylott Rd
- 0 Lipham Rd Unit 10505011
- 2485 Georgia 34
- 14.8 + - Ac Bethel Rd W
- 18+/- Ac Bethel Rd W
- 14.8 +/- AC Bethel Rd W
- 18 +/- AC Bethel Rd W
- 2758 Straylott Rd
- 57+/- Ac Victory Rd
- 0 Drummond Rd Unit 10576586
- 0 Drummond Rd Unit 7642521
- 57+/- AC Victory Rd
- 24.5+/- Ac Awebreys Gin Rd
- 13.9 + - Ac Awebreys Gin Rd
- 13.9 +/- AC Awbreys Gin Rd
- 24.5+/- AC Awbreys Gin Rd
- 5795 Red Land Rd
- 5995 Red Land Rd
- 5644 Redland Rd
- 5136 Ga Highway 34
- 5644 Red Land Rd
- 6085 Red Land Rd
- 165 Evans Dr
- 111 Kelly Cir
- 23 Kelly Cir
- 49 Kelly Cir
- 5425 Red Land Rd
- 121 Kelly Cir
- 5651 Ga Highway 34
- 5537 Georgia 34
- 5537 Ga Highway 34
- 5653 Georgia 34
- 5651 Ga Highway 34
- 145 Kelly Cir
- 5653 Ga Highway 34
- 5653 Ga Highway 34