Estimated Value: $265,000 - $358,000
4
Beds
3
Baths
2,108
Sq Ft
$142/Sq Ft
Est. Value
About This Home
This home is located at 5795 W Camper Rd, Genoa, OH 43430 and is currently estimated at $298,296, approximately $141 per square foot. 5795 W Camper Rd is a home located in Sandusky County with nearby schools including Woodmore Elementary School, Woodmore Middle School, and Community Christian Academy.
Ownership History
Date
Name
Owned For
Owner Type
Purchase Details
Closed on
Nov 22, 2017
Sold by
Spitler Constance L
Bought by
Constance L Spitler
Current Estimated Value
Purchase Details
Closed on
Jun 25, 2008
Sold by
Prudential Relocation Inc
Bought by
Spitler Constance L
Purchase Details
Closed on
Jun 17, 2008
Sold by
Reffitt Rodney W and Reffitt Charlene E
Bought by
Prudential Relocation Inc
Purchase Details
Closed on
Jun 29, 2001
Sold by
Bigelow Sueann M
Bought by
Reffitt Rodney W and Reffitt Charlene E
Home Financials for this Owner
Home Financials are based on the most recent Mortgage that was taken out on this home.
Original Mortgage
$137,000
Interest Rate
7.18%
Mortgage Type
New Conventional
Purchase Details
Closed on
Apr 1, 1987
Bought by
Spitler Constance L
Create a Home Valuation Report for This Property
The Home Valuation Report is an in-depth analysis detailing your home's value as well as a comparison with similar homes in the area
Home Values in the Area
Average Home Value in this Area
Purchase History
| Date | Buyer | Sale Price | Title Company |
|---|---|---|---|
| Constance L Spitler | -- | -- | |
| Spitler Constance L | $157,500 | Attorney | |
| Prudential Relocation Inc | $157,500 | Attorney | |
| Reffitt Rodney W | $137,000 | -- | |
| Spitler Constance L | $74,500 | -- |
Source: Public Records
Mortgage History
| Date | Status | Borrower | Loan Amount |
|---|---|---|---|
| Previous Owner | Reffitt Rodney W | $137,000 |
Source: Public Records
Tax History Compared to Growth
Tax History
| Year | Tax Paid | Tax Assessment Tax Assessment Total Assessment is a certain percentage of the fair market value that is determined by local assessors to be the total taxable value of land and additions on the property. | Land | Improvement |
|---|---|---|---|---|
| 2024 | $3,386 | $76,200 | $11,660 | $64,540 |
| 2023 | $3,386 | $55,620 | $8,510 | $47,110 |
| 2022 | $2,826 | $55,620 | $8,510 | $47,110 |
| 2021 | $2,842 | $55,620 | $8,510 | $47,110 |
| 2020 | $2,606 | $49,350 | $8,330 | $41,020 |
| 2019 | $2,608 | $49,350 | $8,330 | $41,020 |
| 2018 | $2,764 | $49,350 | $8,330 | $41,020 |
| 2017 | $2,377 | $44,000 | $8,330 | $35,670 |
| 2016 | $2,293 | $44,000 | $8,330 | $35,670 |
| 2015 | $2,422 | $44,000 | $8,330 | $35,670 |
| 2014 | $2,420 | $41,730 | $9,490 | $32,240 |
| 2013 | $2,512 | $41,730 | $9,490 | $32,240 |
Source: Public Records
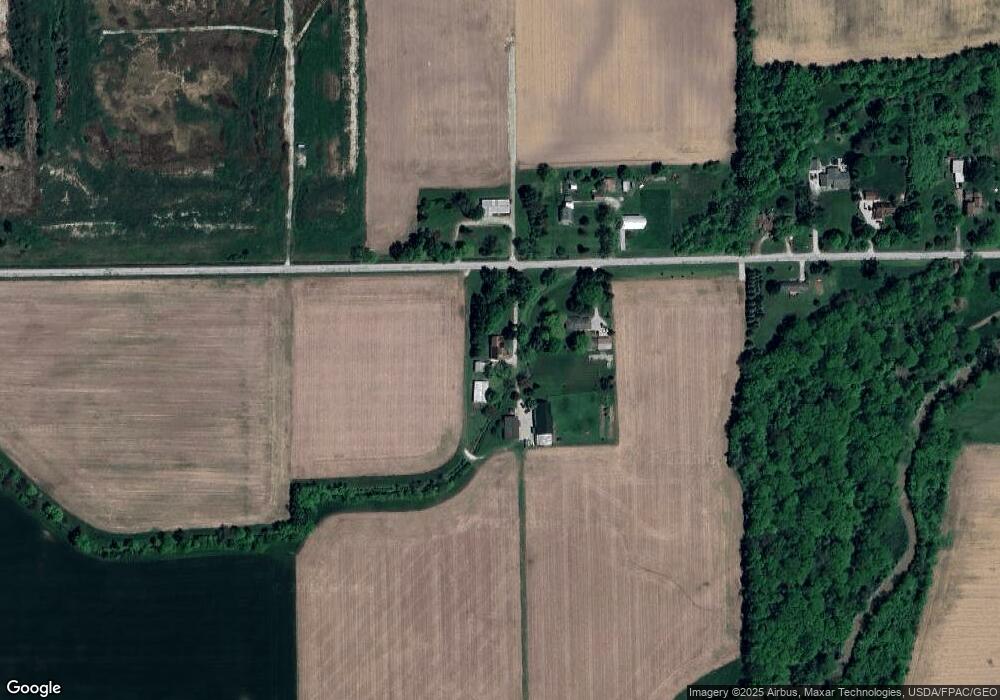
Map
Nearby Homes
- 514 West St
- 510 Wilson St
- 904 Main St
- 207 E 11th St
- 1350 N Genoa Clay Center Rd
- 416 Castle Cove
- 1301 West St
- 19383 Courtland Ave
- 22771 W Holt Harrigan Rd
- 20240 W Portage River South Rd
- 1615 N Thyre Dr
- 0 Recker Rd
- 1861 N Opfer-Lentz Rd
- 219 Lime St
- 212 S Perry St
- 612 W Main St
- 110 E 1st St
- 0 W Portage River Rd S Unit 6130453
- 23225 Ohio 51
- 421 Parklane Dr
- 5770 W Camper Rd
- 5718 W Camper Rd
- 5711 W Camper Rd
- 5700 W Camper Rd
- 5686 W Camper Rd
- 5664 W Camper Rd
- 5630 W Camper Rd
- 5550 County Road 44
- 5585 S Martin Williston Rd
- 5549 S Martin Williston Rd
- 825 S Martin Williston Rd
- 5519 S Martin Williston Rd
- 5491 S Martin Williston Rd
- 5475 S Martin Williston Rd
- 765 S Martin Williston Rd
- 5390 County Road 44
- 1849 Lime Rd
- 20840 W Camper Rd
- 20855 W Camper Rd
- 741 S Martin Williston Rd