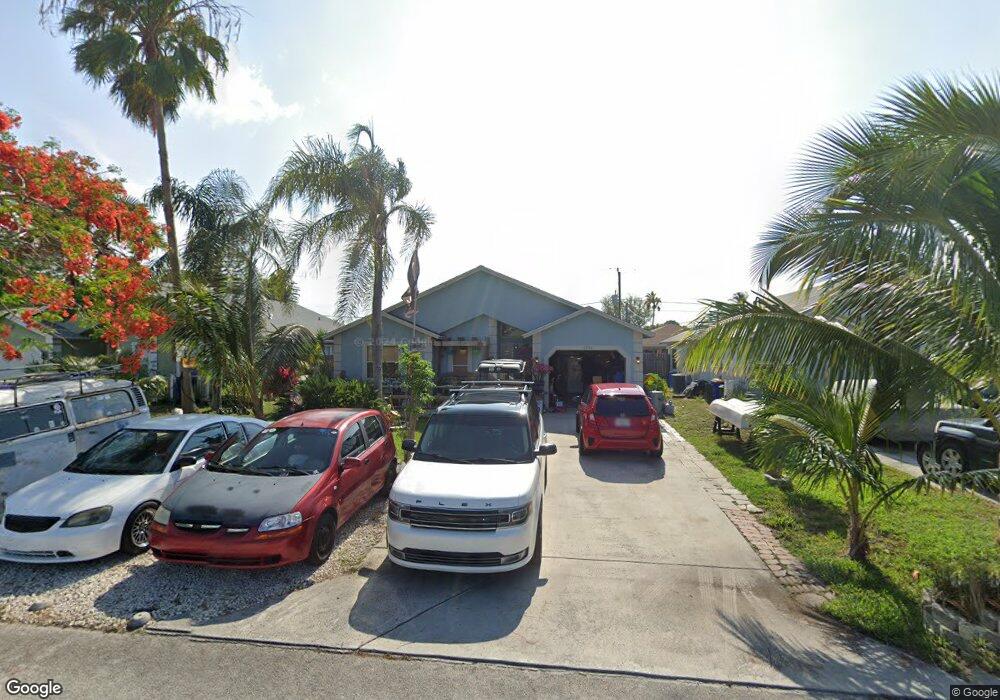
5796 SE Tangerine Blvd Stuart, FL 34997
Estimated Value: $321,377 - $394,000
3
Beds
2
Baths
1,436
Sq Ft
$246/Sq Ft
Est. Value
About This Home
This home is located at 5796 SE Tangerine Blvd, Stuart, FL 34997 and is currently estimated at $353,094, approximately $245 per square foot. 5796 SE Tangerine Blvd is a home located in Martin County with nearby schools including Sea Wind Elementary School, Murray Middle School, and South Fork High School.
Ownership History
Date
Name
Owned For
Owner Type
Purchase Details
Closed on
Sep 10, 2015
Sold by
Dimarzo Debra Elias
Bought by
Mastrapa Nathaniel and Mastrapa Kristy G
Current Estimated Value
Home Financials for this Owner
Home Financials are based on the most recent Mortgage that was taken out on this home.
Original Mortgage
$144,337
Outstanding Balance
$114,666
Interest Rate
4.25%
Mortgage Type
FHA
Estimated Equity
$238,428
Purchase Details
Closed on
Apr 8, 1998
Sold by
Dimarzo Michael and Elias Debra
Bought by
Dimarzo Debra E
Purchase Details
Closed on
Aug 4, 1995
Sold by
Dimarzo Michael V
Bought by
Mastrapa Nathaniel and Mastrapa Kristy G
Purchase Details
Closed on
Nov 30, 1992
Bought by
Mastrapa Nathaniel and Mastrapa Kristy G
Create a Home Valuation Report for This Property
The Home Valuation Report is an in-depth analysis detailing your home's value as well as a comparison with similar homes in the area
Home Values in the Area
Average Home Value in this Area
Purchase History
| Date | Buyer | Sale Price | Title Company |
|---|---|---|---|
| Mastrapa Nathaniel | $147,000 | Florida Title & Guarantee Ag | |
| Dimarzo Debra E | $100 | -- | |
| Mastrapa Nathaniel | -- | -- | |
| Mastrapa Nathaniel | $75,000 | -- |
Source: Public Records
Mortgage History
| Date | Status | Borrower | Loan Amount |
|---|---|---|---|
| Open | Mastrapa Nathaniel | $144,337 | |
| Previous Owner | Dimarzo Debra E | $18,000 |
Source: Public Records
Tax History Compared to Growth
Tax History
| Year | Tax Paid | Tax Assessment Tax Assessment Total Assessment is a certain percentage of the fair market value that is determined by local assessors to be the total taxable value of land and additions on the property. | Land | Improvement |
|---|---|---|---|---|
| 2025 | $2,606 | $177,932 | -- | -- |
| 2024 | $2,606 | $172,918 | -- | -- |
| 2023 | $2,536 | $167,882 | $0 | $0 |
| 2022 | $2,435 | $162,993 | $0 | $0 |
| 2021 | $2,421 | $158,246 | $0 | $0 |
| 2020 | $2,327 | $156,062 | $0 | $0 |
| 2019 | $2,285 | $152,554 | $0 | $0 |
| 2018 | $2,226 | $149,709 | $0 | $0 |
| 2017 | $1,789 | $146,630 | $71,250 | $75,380 |
| 2016 | $2,128 | $107,290 | $38,000 | $69,290 |
| 2015 | $838 | $72,222 | $0 | $0 |
| 2014 | $838 | $71,649 | $0 | $0 |
Source: Public Records
Map
Nearby Homes
- 5360 SE Dell St
- 5715 SE Pine Dr
- 5703 SE Pine Dr
- 5795 SE Mitzi Ln
- 5855 SE Mitzi Ln
- 5914 SE Wilsie Dr
- 5629 SE Collins Ave
- 5431 SE Grafton Ave
- 5584 SE Katharine Ave
- 5261 SE Burning Tree Cir
- 0 SE Primrose Way
- 5611 SE Foxcross Place
- 5540 SE Colee Ave
- 4959 SE Primrose Way
- 5665 SE Winged Foot Dr
- 5311 SE Brandywine Way Unit 28
- 5701 SE Winged Foot Dr
- 5711 SE Winged Foot Dr
- 5071 SE Brandywine Way Unit 8
- 6384 SE Ironwood Cir
- 5784 SE Tangerine Blvd
- 5808 SE Tangerine Blvd
- 5772 SE Tangerine Blvd
- 5820 SE Tangerine Blvd
- 5807 SE Mitzi Ln
- 5819 SE Mitzi Ln
- 5831 SE Mitzi Ln
- 5760 SE Tangerine Blvd
- 5797 SE Tangerine Blvd
- 5785 SE Tangerine Blvd
- 5809 SE Tangerine Blvd
- 5771 SE Mitzi Ln
- 5821 SE Tangerine Blvd
- 5779 SE Tangerine Blvd
- 5832 SE Tangerine Blvd
- 5761 SE Tangerine Blvd
- 5843 SE Mitzi Ln
- 5260 SE Dell St
- 5838 SE Tangerine Blvd
- 5806 SE Mitzi Ln