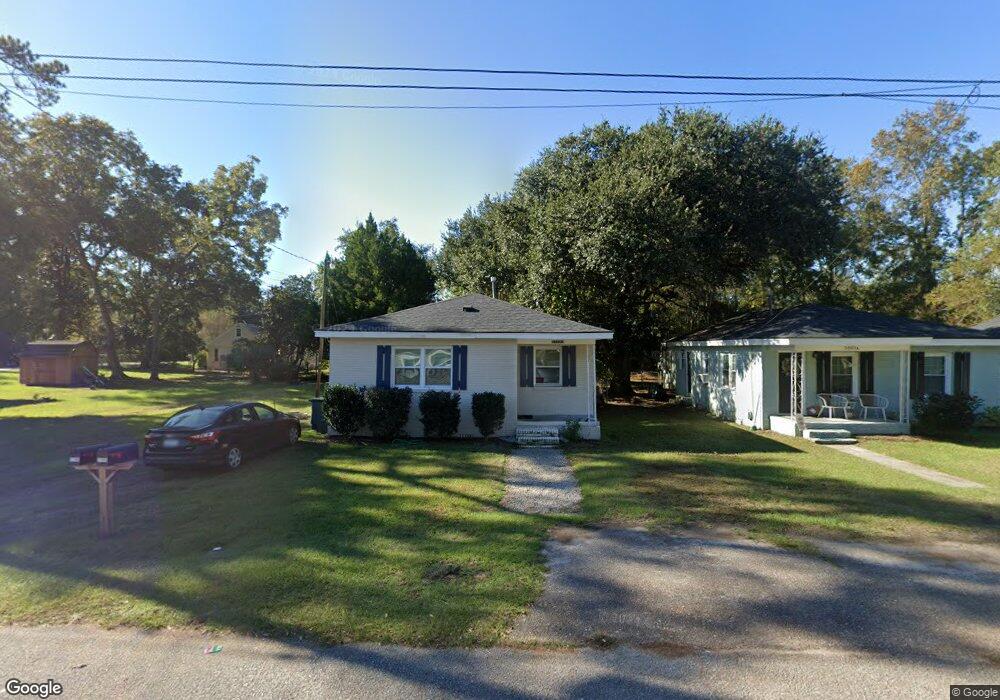
5799 Sledge St Unit A Hanahan, SC 29410
Estimated Value: $265,000 - $337,859
3
Beds
1
Bath
850
Sq Ft
$353/Sq Ft
Est. Value
About This Home
This home is located at 5799 Sledge St Unit A, Hanahan, SC 29410 and is currently estimated at $300,215, approximately $353 per square foot. 5799 Sledge St Unit A is a home located in Berkeley County with nearby schools including Hanahan Elementary School, Hanahan Middle School, and Hanahan High School.
Ownership History
Date
Name
Owned For
Owner Type
Purchase Details
Closed on
Nov 23, 2021
Sold by
Legacy Homes And Designs Llc
Bought by
Sweet Diehl Llc
Current Estimated Value
Home Financials for this Owner
Home Financials are based on the most recent Mortgage that was taken out on this home.
Original Mortgage
$541,500
Outstanding Balance
$496,604
Interest Rate
3.05%
Mortgage Type
Commercial
Estimated Equity
-$196,389
Purchase Details
Closed on
Nov 20, 2020
Sold by
Delk Brenda Joy and Raybon Vicki M
Bought by
Legacy Homes And Designs Llc
Home Financials for this Owner
Home Financials are based on the most recent Mortgage that was taken out on this home.
Original Mortgage
$150,000
Interest Rate
2.8%
Mortgage Type
New Conventional
Purchase Details
Closed on
Jan 31, 2004
Sold by
Best Frank T
Bought by
Miller Dianne L
Create a Home Valuation Report for This Property
The Home Valuation Report is an in-depth analysis detailing your home's value as well as a comparison with similar homes in the area
Home Values in the Area
Average Home Value in this Area
Purchase History
| Date | Buyer | Sale Price | Title Company |
|---|---|---|---|
| Sweet Diehl Llc | $730,000 | None Available | |
| Legacy Homes And Designs Llc | $315,000 | Weeks & Irvine Llc | |
| Miller Dianne L | -- | -- |
Source: Public Records
Mortgage History
| Date | Status | Borrower | Loan Amount |
|---|---|---|---|
| Open | Sweet Diehl Llc | $541,500 | |
| Previous Owner | Legacy Homes And Designs Llc | $150,000 |
Source: Public Records
Tax History Compared to Growth
Tax History
| Year | Tax Paid | Tax Assessment Tax Assessment Total Assessment is a certain percentage of the fair market value that is determined by local assessors to be the total taxable value of land and additions on the property. | Land | Improvement |
|---|---|---|---|---|
| 2025 | $4,413 | $236,095 | $56,627 | $179,468 |
| 2024 | $4,311 | $14,166 | $3,398 | $10,768 |
| 2023 | $4,311 | $14,166 | $3,398 | $10,768 |
| 2022 | $4,101 | $12,318 | $6,000 | $6,318 |
| 2021 | $2,826 | $6,180 | $1,066 | $5,110 |
| 2020 | $2,055 | $6,176 | $1,066 | $5,110 |
| 2019 | $2,076 | $6,176 | $1,066 | $5,110 |
| 2018 | $1,931 | $5,370 | $1,200 | $4,170 |
| 2017 | $1,920 | $5,370 | $1,200 | $4,170 |
| 2016 | $1,933 | $5,370 | $1,200 | $4,170 |
| 2015 | $1,827 | $5,370 | $1,200 | $4,170 |
| 2014 | $1,670 | $5,370 | $1,200 | $4,170 |
| 2013 | -- | $5,370 | $1,200 | $4,170 |
Source: Public Records
Map
Nearby Homes
- 5814 Robinson St Unit A,B,C,D
- 5815 Robinson St
- 1114 Melvin Dr
- 0 Attaway St Unit 25028362
- 5806 Edinburgh Dr
- 1230 Hawthorne Cir
- 5821 Robinhood Dr
- 1206 Hawthorne Rd
- 1209 Palm St
- 0 Pine Ct
- 5538 Blackwell Ave
- 1507 Sumner Ave
- 1121 Inverness Ln
- 1139 Belvedere Dr
- 1652 Larry St
- 5914 Tampa St
- 5841 Kirkwood Ave
- 5816 Beverly Dr
- 5810 Beverly Dr
- 1609 Larry St
- 5799 Sledge St
- 5801 Sledge St
- 5803 Sledge St
- 1238 Dickson Ave
- 5805 Sledge St
- 5797 Sledge
- 1230 Dickson Ave
- 5804 Sledge St
- 5802 Sledge St
- 5806 Sledge St
- 5806 Sledge St Unit C
- 5807 Sledge St
- 5808 Sledge St
- 1226 Dickson Ave
- 5810 Sledge St
- 5808 Robinson St
- 5809 Sledge St
- 1241 Dickson Ave
- 1239 Dickson Ave
- 5810 Robinson St