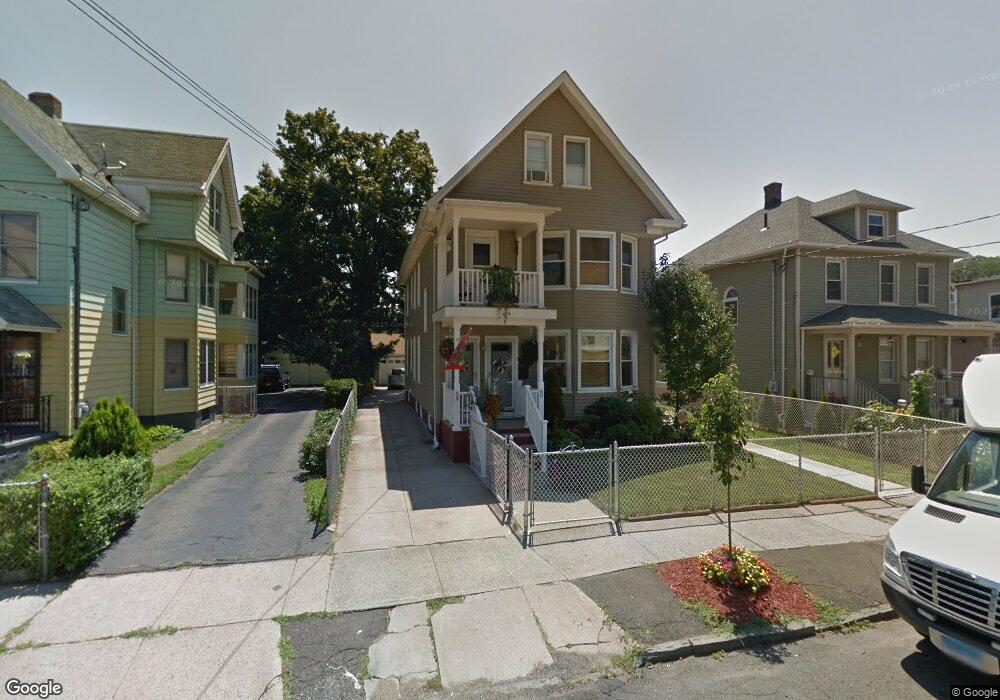
58 Alling St West Haven, CT 06516
Allingtown NeighborhoodEstimated Value: $445,259 - $518,000
2
Beds
2
Baths
3,064
Sq Ft
$160/Sq Ft
Est. Value
About This Home
This home is located at 58 Alling St, West Haven, CT 06516 and is currently estimated at $491,315, approximately $160 per square foot. 58 Alling St is a home located in New Haven County with nearby schools including Carrigan 5/6 Intermediate School, Harry M. Bailey Middle School, and West Haven High School.
Ownership History
Date
Name
Owned For
Owner Type
Purchase Details
Closed on
Feb 4, 2013
Sold by
Rivera Carmen L
Bought by
Colon Ivette and Colon Carlos R
Current Estimated Value
Home Financials for this Owner
Home Financials are based on the most recent Mortgage that was taken out on this home.
Original Mortgage
$227,500
Outstanding Balance
$159,035
Interest Rate
3.41%
Mortgage Type
New Conventional
Estimated Equity
$332,280
Purchase Details
Closed on
Mar 23, 2001
Sold by
Dejesus Jose
Bought by
Rivera Inocencio
Purchase Details
Closed on
Mar 30, 2000
Sold by
Department Of Housing & Urban Dev
Bought by
Dejesus Jose
Purchase Details
Closed on
Jul 28, 1995
Sold by
Weber Anna M
Bought by
Byrd James N
Create a Home Valuation Report for This Property
The Home Valuation Report is an in-depth analysis detailing your home's value as well as a comparison with similar homes in the area
Home Values in the Area
Average Home Value in this Area
Purchase History
| Date | Buyer | Sale Price | Title Company |
|---|---|---|---|
| Colon Ivette | $221,000 | -- | |
| Colon Ivette | $221,000 | -- | |
| Rivera Inocencio | $109,900 | -- | |
| Rivera Inocencio | $109,900 | -- | |
| Dejesus Jose | $84,550 | -- | |
| Dejesus Jose | $84,550 | -- | |
| Byrd James N | $100,000 | -- | |
| Byrd James N | $100,000 | -- |
Source: Public Records
Mortgage History
| Date | Status | Borrower | Loan Amount |
|---|---|---|---|
| Open | Byrd James N | $227,500 | |
| Closed | Byrd James N | $227,500 | |
| Previous Owner | Byrd James N | $27,550 |
Source: Public Records
Tax History Compared to Growth
Tax History
| Year | Tax Paid | Tax Assessment Tax Assessment Total Assessment is a certain percentage of the fair market value that is determined by local assessors to be the total taxable value of land and additions on the property. | Land | Improvement |
|---|---|---|---|---|
| 2025 | $9,567 | $277,060 | $60,200 | $216,860 |
| 2024 | $9,062 | $186,760 | $41,720 | $145,040 |
| 2023 | $8,686 | $186,760 | $41,720 | $145,040 |
| 2022 | $8,516 | $186,760 | $41,720 | $145,040 |
| 2021 | $8,516 | $186,760 | $41,720 | $145,040 |
| 2020 | $7,649 | $151,550 | $33,600 | $117,950 |
| 2019 | $7,376 | $151,550 | $33,600 | $117,950 |
| 2018 | $7,312 | $151,550 | $33,600 | $117,950 |
| 2017 | $6,920 | $151,550 | $33,600 | $117,950 |
| 2016 | $6,905 | $151,550 | $33,600 | $117,950 |
| 2015 | $6,477 | $160,510 | $37,310 | $123,200 |
| 2014 | $6,436 | $160,510 | $37,310 | $123,200 |
Source: Public Records
Map
Nearby Homes
- 941 Campbell Ave
- 1014 Campbell Ave Unit 14
- 104 Terrace Ave
- 43 Clifton St
- 29 Abner St
- 14 Homestead Ave
- 25 Richards St
- 35 Terrace Ave
- 161 W Spring St Unit B2
- 161 W Spring St Unit C1
- 22 Thill St
- 28 Wharton St
- 63 Glade St Unit C1
- 81 Homeside Ave
- 170 Wood St
- 24 George St
- 677 Washington Ave
- 194 Homeside Ave
- 38 Chauncey St
- 60 Andrews St
- 62 Alling St
- 54 Alling St
- 50 Alling St
- 46 Alling St
- 1003 Campbell Ave
- 44 Alling St
- 1007 Campbell Ave
- 53 Alling St
- 1011 Campbell Ave
- 36 Alling St
- 49 Alling St
- 191 Lamson St
- 191 Lamson St Unit 3rd floor
- 193 Lamson St
- 34 Alling St
- 973 Campbell Ave
- 181 Lamson St
- 197 Lamson St
- 1019 Campbell Ave
- 183 Lamson St