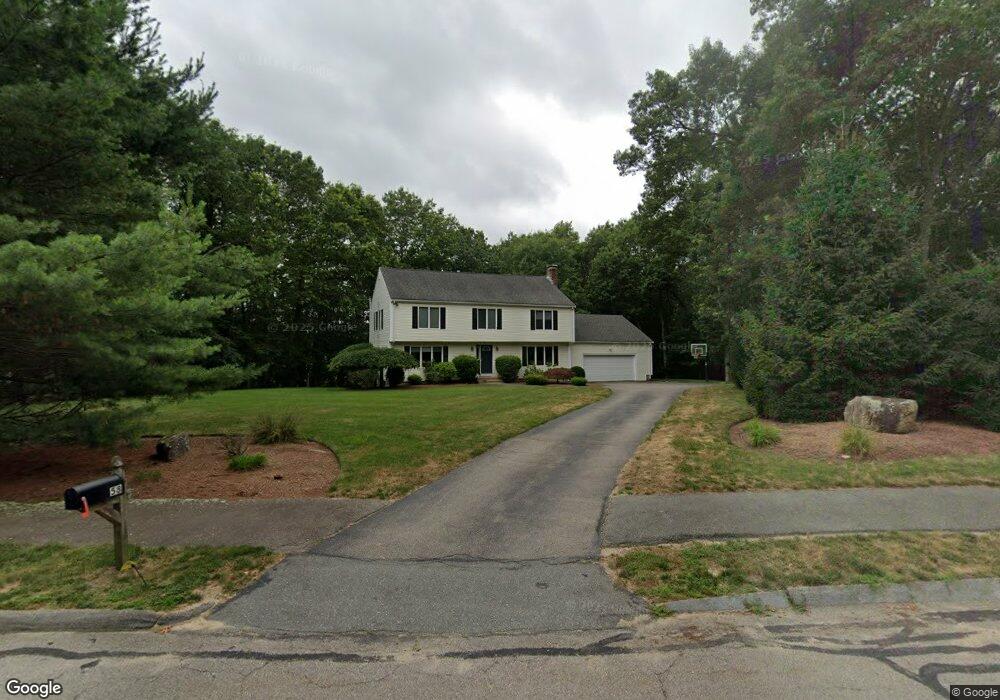
58 Azalea Rd Sharon, MA 02067
Estimated Value: $1,157,386 - $1,234,000
4
Beds
4
Baths
3,699
Sq Ft
$321/Sq Ft
Est. Value
About This Home
This home is located at 58 Azalea Rd, Sharon, MA 02067 and is currently estimated at $1,188,847, approximately $321 per square foot. 58 Azalea Rd is a home located in Norfolk County with nearby schools including East Elementary School, Sharon Middle School, and Sharon High School.
Ownership History
Date
Name
Owned For
Owner Type
Purchase Details
Closed on
Sep 12, 2008
Sold by
Boxerman Jerrold L and Boxerman Heather R
Bought by
Silverman Glen T and Silverman Sharon B
Current Estimated Value
Purchase Details
Closed on
Aug 29, 2002
Sold by
Girard Andrew A and Girard Jodi B
Bought by
Baxerman Jerrold L and Baxerman Heather R
Purchase Details
Closed on
Jan 30, 1998
Sold by
Pollack Arthur M and Susan Pollack E
Bought by
Girard Andrew A and Girard Jodi B
Create a Home Valuation Report for This Property
The Home Valuation Report is an in-depth analysis detailing your home's value as well as a comparison with similar homes in the area
Home Values in the Area
Average Home Value in this Area
Purchase History
| Date | Buyer | Sale Price | Title Company |
|---|---|---|---|
| Silverman Glen T | $605,000 | -- | |
| Baxerman Jerrold L | $569,900 | -- | |
| Girard Andrew A | $300,000 | -- |
Source: Public Records
Mortgage History
| Date | Status | Borrower | Loan Amount |
|---|---|---|---|
| Open | Girard Andrew A | $402,000 | |
| Closed | Girard Andrew A | $70,000 | |
| Closed | Girard Andrew A | $412,500 |
Source: Public Records
Tax History Compared to Growth
Tax History
| Year | Tax Paid | Tax Assessment Tax Assessment Total Assessment is a certain percentage of the fair market value that is determined by local assessors to be the total taxable value of land and additions on the property. | Land | Improvement |
|---|---|---|---|---|
| 2025 | $17,059 | $975,900 | $464,200 | $511,700 |
| 2024 | $16,409 | $933,400 | $425,900 | $507,500 |
| 2023 | $15,630 | $840,800 | $398,200 | $442,600 |
| 2022 | $14,903 | $754,600 | $331,800 | $422,800 |
| 2021 | $14,785 | $723,700 | $312,800 | $410,900 |
| 2020 | $14,022 | $738,000 | $327,100 | $410,900 |
| 2019 | $13,348 | $687,700 | $276,800 | $410,900 |
| 2018 | $13,218 | $682,400 | $271,500 | $410,900 |
| 2017 | $13,043 | $664,800 | $253,900 | $410,900 |
| 2016 | $12,766 | $634,800 | $279,300 | $355,500 |
| 2015 | $12,866 | $633,800 | $279,300 | $354,500 |
| 2014 | $11,921 | $580,100 | $254,000 | $326,100 |
Source: Public Records
Map
Nearby Homes
- 6 Tall Tree Rd
- 30 Hampton Rd
- 74 Eisenhower Dr
- 71 Morse St
- 15 Paul Revere Rd
- 40 Lyndon Rd
- 376 Mountain St
- 157 Wilshire Dr
- 350 Mountain St
- 285 Massapoag Ave
- 172 Wilshire Dr
- 16 Deerfield Rd
- 49 Cottage St
- 150 Pond St
- 2 Palace Ct
- 137 Pond St
- 14 Cottage St
- 5 Trowel Pond Shop Rd Unit C
- 6 Grove Ave
- 148 S Main St