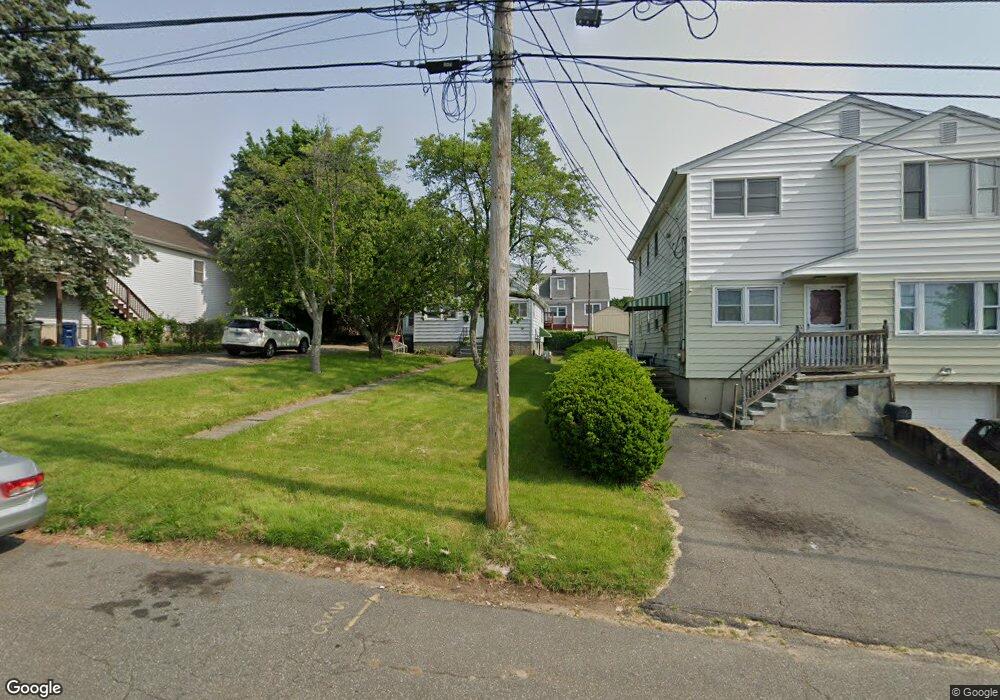
58 Balsam Ave Bridgeport, CT 06606
Reservoir-Whiskey Hill NeighborhoodEstimated Value: $356,000 - $453,000
3
Beds
2
Baths
1,139
Sq Ft
$336/Sq Ft
Est. Value
About This Home
This home is located at 58 Balsam Ave, Bridgeport, CT 06606 and is currently estimated at $383,057, approximately $336 per square foot. 58 Balsam Ave is a home located in Fairfield County with nearby schools including Hallen School, Central High School, and Northeastern Adventist Academy - Fairfield County.
Ownership History
Date
Name
Owned For
Owner Type
Purchase Details
Closed on
Sep 27, 2002
Sold by
Mehta Samir K
Bought by
Obih Anthonia C
Current Estimated Value
Home Financials for this Owner
Home Financials are based on the most recent Mortgage that was taken out on this home.
Original Mortgage
$252,000
Outstanding Balance
$106,344
Interest Rate
6.25%
Estimated Equity
$276,713
Purchase Details
Closed on
Oct 28, 1999
Sold by
Collazo Rolando
Bought by
Mehta Samir K
Home Financials for this Owner
Home Financials are based on the most recent Mortgage that was taken out on this home.
Original Mortgage
$148,750
Interest Rate
10.24%
Purchase Details
Closed on
Jun 17, 1998
Sold by
Rodriguez Jose and Rodriguez Marie
Bought by
Collaza Rolando
Create a Home Valuation Report for This Property
The Home Valuation Report is an in-depth analysis detailing your home's value as well as a comparison with similar homes in the area
Home Values in the Area
Average Home Value in this Area
Purchase History
| Date | Buyer | Sale Price | Title Company |
|---|---|---|---|
| Obih Anthonia C | $280,000 | -- | |
| Obih Anthonia C | $280,000 | -- | |
| Mehta Samir K | $175,000 | -- | |
| Mehta Samir K | $175,000 | -- | |
| Collaza Rolando | $140,000 | -- | |
| Collaza Rolando | $140,000 | -- |
Source: Public Records
Mortgage History
| Date | Status | Borrower | Loan Amount |
|---|---|---|---|
| Open | Collaza Rolando | $252,000 | |
| Closed | Collaza Rolando | $252,000 | |
| Previous Owner | Collaza Rolando | $148,750 |
Source: Public Records
Tax History Compared to Growth
Tax History
| Year | Tax Paid | Tax Assessment Tax Assessment Total Assessment is a certain percentage of the fair market value that is determined by local assessors to be the total taxable value of land and additions on the property. | Land | Improvement |
|---|---|---|---|---|
| 2025 | $6,001 | $138,120 | $64,930 | $73,190 |
| 2024 | $6,001 | $138,120 | $64,930 | $73,190 |
| 2023 | $6,001 | $138,120 | $64,930 | $73,190 |
| 2022 | $6,001 | $138,120 | $64,930 | $73,190 |
| 2021 | $6,001 | $138,120 | $64,930 | $73,190 |
| 2020 | $5,247 | $97,190 | $37,370 | $59,820 |
| 2019 | $5,247 | $97,190 | $37,370 | $59,820 |
| 2018 | $5,284 | $97,190 | $37,370 | $59,820 |
| 2017 | $5,284 | $97,190 | $37,370 | $59,820 |
| 2016 | $5,284 | $97,190 | $37,370 | $59,820 |
| 2015 | $5,588 | $132,410 | $53,790 | $78,620 |
| 2014 | $5,588 | $132,410 | $53,790 | $78,620 |
Source: Public Records
Map
Nearby Homes
- 1088 Sylvan Ave
- 16 Oakdale St
- 49 Soundview Ave
- 1053 Sylvan Ave
- 250 Dayton Rd
- 217 Hillcrest Rd
- 17 Sylvan St
- 438 Soundview Ave
- 181 Cityview Ave
- 15 Edwards St
- 539 Old Town Rd
- 717 Reservoir Ave
- 705 Reservoir Ave
- 182 Trumbull Ave
- 769 Sylvan Ave Unit 16
- 769 Sylvan Ave Unit 13
- 36 Platt St
- 130 Wilkins Ave
- 110 Wilkins Ave
- 28 Wilkins Ave
- 78 Balsam Ave
- 44 Balsam Ave
- 50 Balsam Ave
- 79 Hollywood Ave
- 87 Hollywood Ave
- 88 Balsam Ave
- 65 Hollywood Ave
- 0 Balsam Ave Unit 2
- 97 Hollywood Ave
- 61 Balsam Ave
- 55 Balsam Ave
- 28 Balsam Ave
- 75 Balsam Ave
- 45 Balsam Ave
- 94 Balsam Ave
- 94 Balsam Ave Unit 1
- 41 Hollywood Ave
- 85 Balsam Ave
- 89 Hollywood Ave
- 31 Balsam Ave