58 Blackstone Rd Attleboro, MA 02703
Estimated Value: $509,000 - $636,000
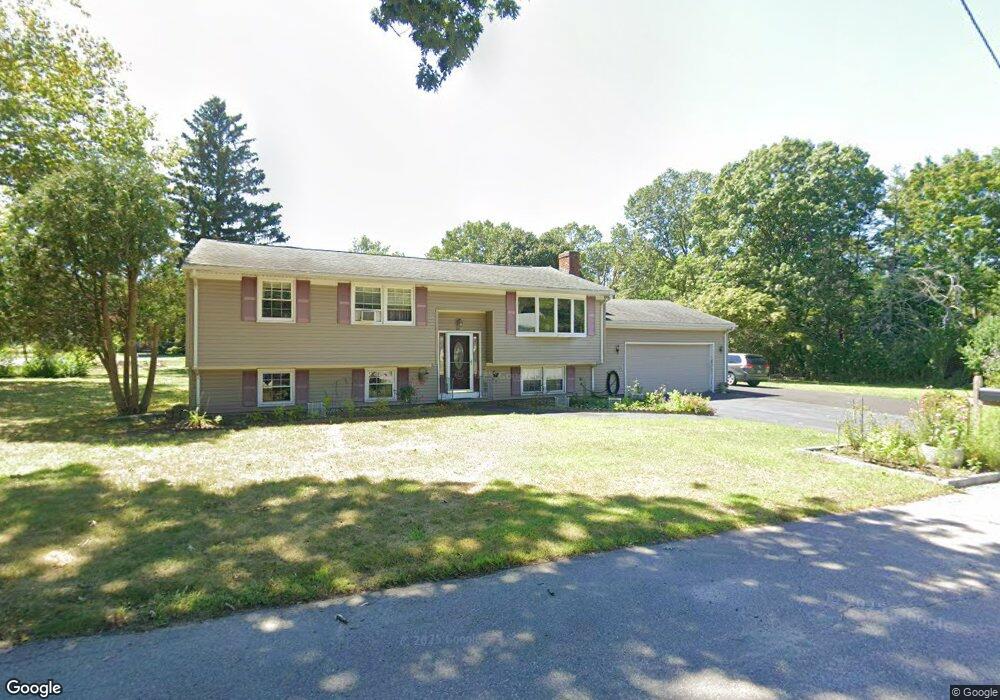
About This Home
This home is located at 58 Blackstone Rd, Attleboro, MA 02703 and is currently estimated at $582,548, approximately $314 per square foot. 58 Blackstone Rd is a home located in Bristol County with nearby schools including A. Irvin Studley Elementary School, Cyril K. Brennan Middle School, and Attleboro High School.
Ownership History
We collect this data history from publicly available records. To have your information removed, we recommend requesting removal directly through your county’s website.
Purchase Details
Home Financials for this Owner
Home Financials are based on the most recent Mortgage that was taken out on this home.Purchase Details
Home Financials for this Owner
Home Financials are based on the most recent Mortgage that was taken out on this home.Home Values in the Area
Average Home Value in this Area
Purchase History
We collect this data history from publicly available records. To have your information removed, we recommend requesting removal directly through your county’s website.
| Date | Buyer | Sale Price | Title Company |
|---|---|---|---|
| -- | -- | ||
| $300,000 | -- |
Mortgage History
We collect this data history from publicly available records. To have your information removed, we recommend requesting removal directly through your county’s website.
| Date | Status | Borrower | Loan Amount |
|---|---|---|---|
| Open | $182,000 | ||
| Previous Owner | $180,000 |
Tax History
We collect this data history from publicly available records. To have your information removed, we recommend requesting removal directly through your county’s website.
| Year | Tax Paid | Tax Assessment Tax Assessment Total Assessment is a certain percentage of the fair market value that is determined by local assessors to be the total taxable value of land and additions on the property. | Land | Improvement |
|---|---|---|---|---|
| 2025 | $5,232 | $416,900 | $175,200 | $241,700 |
| 2024 | $5,017 | $394,100 | $157,800 | $236,300 |
| 2023 | $4,969 | $363,000 | $159,400 | $203,600 |
| 2022 | $4,761 | $329,500 | $152,000 | $177,500 |
| 2021 | $4,477 | $302,500 | $146,200 | $156,300 |
| 2020 | $4,208 | $289,000 | $139,600 | $149,400 |
| 2019 | $3,990 | $281,800 | $137,000 | $144,800 |
| 2018 | $3,864 | $260,700 | $133,000 | $127,700 |
| 2017 | $3,754 | $258,000 | $129,600 | $128,400 |
| 2016 | $3,503 | $236,400 | $121,000 | $115,400 |
| 2015 | $3,466 | $235,600 | $121,000 | $114,600 |
| 2014 | $3,332 | $224,400 | $115,800 | $108,600 |
Map
- 3 Willett Dr
- 160 West St
- 188 Glendale Rd
- 232 West St
- 70 Westwood Park Cir
- 18 North Ave
- 2 Thomas Cir
- 23 Milk St Unit 2
- 32 West St
- 75 Dennis St Unit 3
- 20 Hodges St
- 64 Mechanic St Unit 3
- 64 Mechanic St
- 660 Thacher St Unit 402
- 101 South Ave Unit 302
- 25 4th St
- 9 Burt St
- 234 County St
- 45 Massasoit Dr
- 386 Thacher St
Ask me questions while you tour the home.