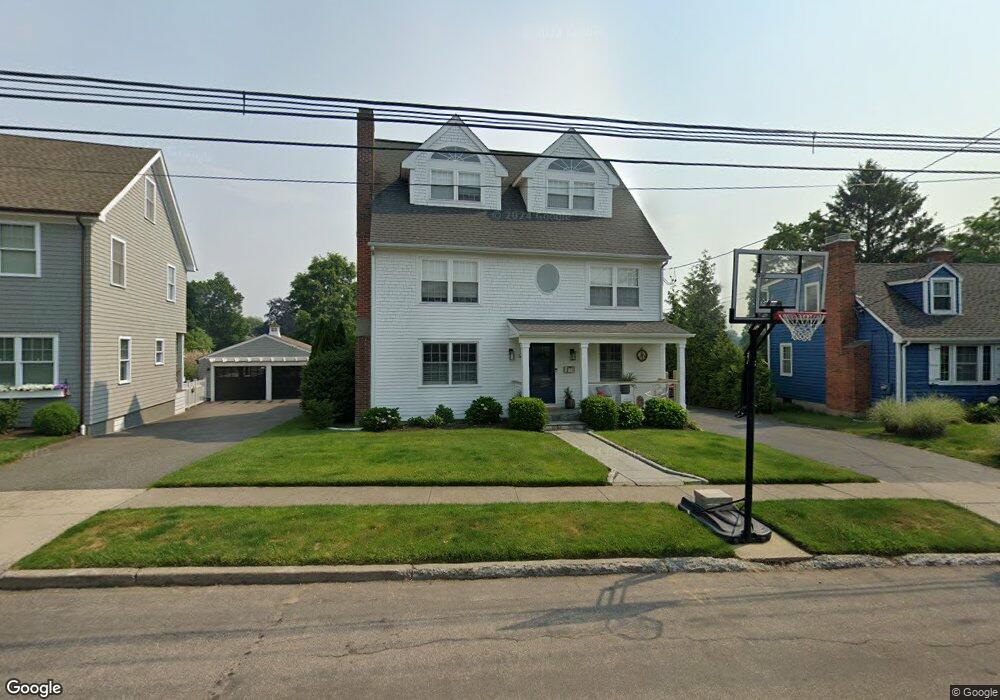
58 Blake Dr Fairfield, CT 06824
Fairfield Center NeighborhoodEstimated Value: $1,343,000 - $1,637,000
3
Beds
3
Baths
2,564
Sq Ft
$582/Sq Ft
Est. Value
About This Home
This home is located at 58 Blake Dr, Fairfield, CT 06824 and is currently estimated at $1,491,329, approximately $581 per square foot. 58 Blake Dr is a home located in Fairfield County with nearby schools including Mill Hill School, Roger Ludlowe Middle School, and Fairfield Ludlowe High School.
Ownership History
Date
Name
Owned For
Owner Type
Purchase Details
Closed on
Nov 27, 2006
Sold by
Akhundzadeh Rcozbeb
Bought by
Wade Elizabeth and Wade Jeffrey
Current Estimated Value
Purchase Details
Closed on
Aug 1, 2005
Sold by
Joshi Savita and Joshi Amitabh
Bought by
Khanzadeh Rouzbeh A
Purchase Details
Closed on
Feb 28, 2000
Sold by
Gardina David D and Gardina Josephine C
Bought by
Joshi Savita and Joshi Amitabh
Purchase Details
Closed on
Jul 15, 1999
Sold by
Hartigan Patricia M
Bought by
Giardina Barbara
Purchase Details
Closed on
Jun 17, 1996
Sold by
Moore Oral T and Moore Barbara J
Bought by
Hartigan Patricia M
Create a Home Valuation Report for This Property
The Home Valuation Report is an in-depth analysis detailing your home's value as well as a comparison with similar homes in the area
Home Values in the Area
Average Home Value in this Area
Purchase History
| Date | Buyer | Sale Price | Title Company |
|---|---|---|---|
| Wade Elizabeth | $690,000 | -- | |
| Wade Elizabeth | $690,000 | -- | |
| Khanzadeh Rouzbeh A | $490,000 | -- | |
| Khanzadeh Rouzbeh A | $490,000 | -- | |
| Joshi Savita | $310,000 | -- | |
| Joshi Savita | $310,000 | -- | |
| Giardina Barbara | $295,500 | -- | |
| Giardina Barbara | $295,500 | -- | |
| Hartigan Patricia M | $246,000 | -- | |
| Hartigan Patricia M | $246,000 | -- |
Source: Public Records
Mortgage History
| Date | Status | Borrower | Loan Amount |
|---|---|---|---|
| Open | Hartigan Patricia M | $590,000 | |
| Closed | Hartigan Patricia M | $562,500 |
Source: Public Records
Tax History
| Year | Tax Paid | Tax Assessment Tax Assessment Total Assessment is a certain percentage of the fair market value that is determined by local assessors to be the total taxable value of land and additions on the property. | Land | Improvement |
|---|---|---|---|---|
| 2025 | $15,489 | $545,580 | $262,570 | $283,010 |
| 2024 | $15,222 | $545,580 | $262,570 | $283,010 |
| 2023 | $15,009 | $545,580 | $262,570 | $283,010 |
| 2022 | $14,862 | $545,580 | $262,570 | $283,010 |
| 2021 | $13,452 | $498,610 | $262,570 | $236,040 |
| 2020 | $12,688 | $473,620 | $232,330 | $241,290 |
| 2019 | $12,688 | $473,620 | $232,330 | $241,290 |
| 2018 | $12,485 | $473,620 | $232,330 | $241,290 |
| 2017 | $12,229 | $473,620 | $232,330 | $241,290 |
| 2016 | $12,054 | $473,620 | $232,330 | $241,290 |
| 2015 | $10,925 | $440,720 | $251,370 | $189,350 |
| 2014 | $10,754 | $440,720 | $251,370 | $189,350 |
Source: Public Records
Map
Nearby Homes
- 75 Spinning Wheel Rd
- 49 South St
- 464 Ruane St
- 88 Overhill Rd
- 127 Paul Place
- 65 Thorpe St Unit 65
- 110 Alden St
- 154 Gorham Rd
- 110 Pratt St
- 28 Michaela Cir
- 188 Henderson Rd
- 972 S Pine Creek Rd
- 187 Catherine Terrace
- 345 Reef Rd Unit B6
- 345 Reef Rd Unit C9
- 245 Unquowa Rd Unit 82
- 88 Veres St
- 329 Bronson Rd
- 510 Reef Rd
- 53 Hilltop Dr
Your Personal Tour Guide
Ask me questions while you tour the home.