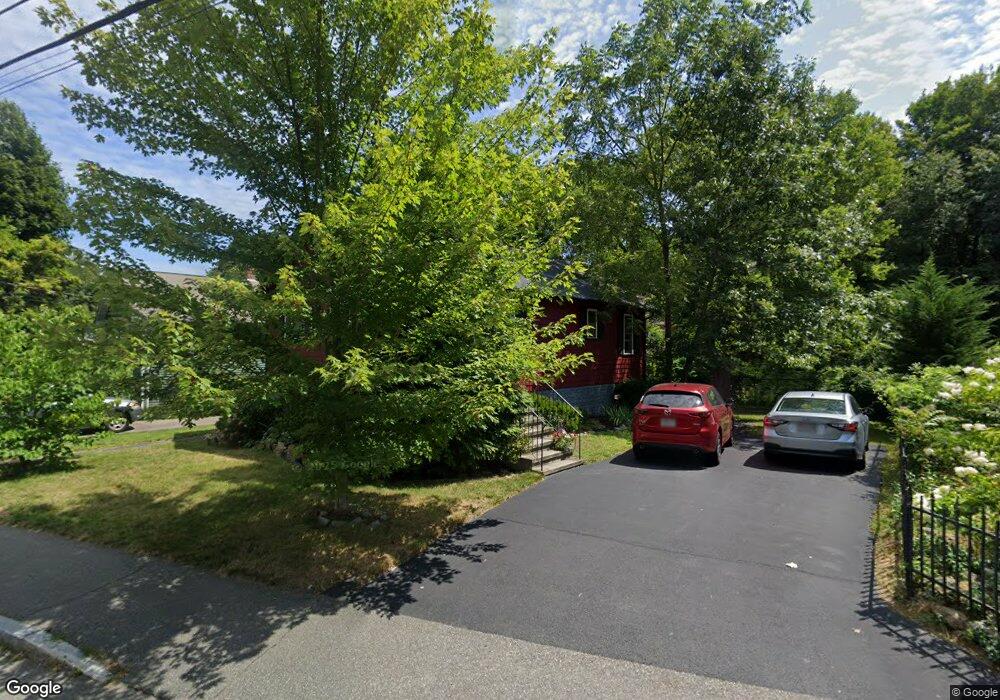
58 Brookside Rd Braintree, MA 02184
East Braintree NeighborhoodEstimated Value: $484,000 - $608,000
3
Beds
1
Bath
1,199
Sq Ft
$471/Sq Ft
Est. Value
About This Home
This home is located at 58 Brookside Rd, Braintree, MA 02184 and is currently estimated at $564,223, approximately $470 per square foot. 58 Brookside Rd is a home located in Norfolk County with nearby schools including Braintree High School, Sacred Heart Elementary School, and South Shore Christian Academy.
Ownership History
Date
Name
Owned For
Owner Type
Purchase Details
Closed on
Jan 26, 2023
Sold by
Tobin Nancy S
Bought by
Tobin Rt
Current Estimated Value
Purchase Details
Closed on
May 1, 2008
Sold by
Mount Pleasant Rt and Mctigue Paul
Bought by
Smith Nancy
Home Financials for this Owner
Home Financials are based on the most recent Mortgage that was taken out on this home.
Original Mortgage
$184,000
Interest Rate
5.99%
Mortgage Type
Purchase Money Mortgage
Purchase Details
Closed on
Oct 29, 2007
Sold by
Hartmann John E
Bought by
Mount Pleasant Rt and Mctigue Paul
Purchase Details
Closed on
Apr 1, 1997
Sold by
Murphy Timothy J
Bought by
Hartmann John E
Purchase Details
Closed on
Oct 5, 1987
Sold by
Gavin Tr Joseph H
Bought by
Murphy Timothy J
Create a Home Valuation Report for This Property
The Home Valuation Report is an in-depth analysis detailing your home's value as well as a comparison with similar homes in the area
Home Values in the Area
Average Home Value in this Area
Purchase History
| Date | Buyer | Sale Price | Title Company |
|---|---|---|---|
| Tobin Rt | -- | None Available | |
| Smith Nancy | $230,000 | -- | |
| Mount Pleasant Rt | $212,000 | -- | |
| Hartmann John E | $120,000 | -- | |
| Hartmann John E | $120,000 | -- | |
| Murphy Timothy J | $120,000 | -- |
Source: Public Records
Mortgage History
| Date | Status | Borrower | Loan Amount |
|---|---|---|---|
| Previous Owner | Murphy Timothy J | $182,000 | |
| Previous Owner | Smith Nancy | $184,000 | |
| Previous Owner | Murphy Timothy J | $200,000 | |
| Previous Owner | Murphy Timothy J | $122,500 |
Source: Public Records
Tax History
| Year | Tax Paid | Tax Assessment Tax Assessment Total Assessment is a certain percentage of the fair market value that is determined by local assessors to be the total taxable value of land and additions on the property. | Land | Improvement |
|---|---|---|---|---|
| 2025 | $5,149 | $515,900 | $324,100 | $191,800 |
| 2024 | $4,646 | $490,100 | $302,200 | $187,900 |
| 2023 | $4,423 | $453,200 | $271,600 | $181,600 |
| 2022 | $4,248 | $426,900 | $245,300 | $181,600 |
| 2021 | $3,663 | $368,100 | $221,600 | $146,500 |
| 2020 | $3,372 | $342,000 | $201,500 | $140,500 |
| 2019 | $3,177 | $314,900 | $192,700 | $122,200 |
| 2018 | $3,085 | $292,700 | $175,200 | $117,500 |
| 2017 | $3,049 | $283,900 | $166,400 | $117,500 |
| 2016 | $2,745 | $250,000 | $140,200 | $109,800 |
| 2015 | $2,701 | $244,000 | $138,400 | $105,600 |
| 2014 | $2,646 | $231,700 | $126,100 | $105,600 |
Source: Public Records
Map
Nearby Homes
- 37 Lantern Ln
- 41 Lantern Ln
- 140 Commercial St
- 122 Washington St Unit Twenty-two
- 25 Richmond St
- 15 Summer St
- 54 Edgemont Rd
- 19 Vine St Unit 2
- 300 Commercial St Unit 23
- 46 Roosevelt Rd
- 15 Dana Rd
- 33 Congress St
- 26 Tingley Rd
- 312 Shaw St
- 82 Lester Ln
- 211 Roosevelt Rd
- 31 Doris Rd
- 255 River St
- 564 Middle St
- 70 Biscayne Ave
- 54 Brookside Rd
- 60 Brookside Rd
- 50 Brookside Rd
- 59 Brookside Rd
- 55 Brookside Rd
- 63 Brookside Rd
- 5 Elmwood Park Aka 23 Front St
- 5 Elmwood Park
- 53 Brookside Rd
- 72 Brookside Rd
- 49 Brookside Rd
- 45 Brookside Rd
- 28 Brookside Rd
- 41 Brookside Rd
- 24-26 Brookside Rd
- 24 Brookside Rd Unit 26
- 31 Brookside Rd
- 37 Elmwood Park
- 37 Elmwood Park Unit single fam.
- 27 Elmwood Park
Your Personal Tour Guide
Ask me questions while you tour the home.