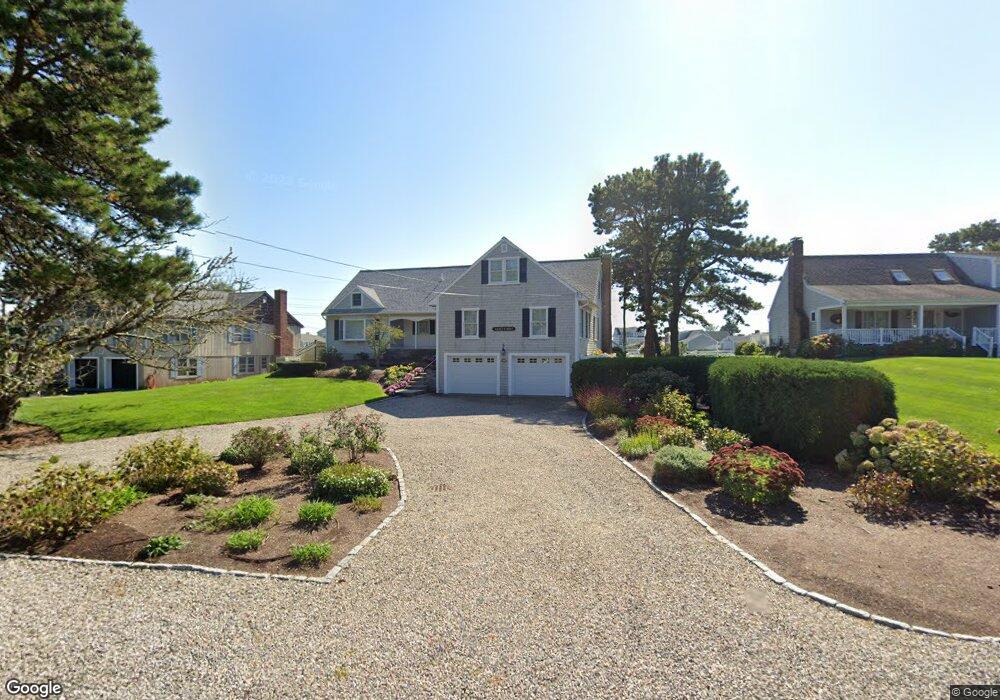
58 Buckley Rd West Dennis, MA 02670
West Dennis NeighborhoodEstimated Value: $1,780,000 - $2,073,000
6
Beds
4
Baths
3,442
Sq Ft
$550/Sq Ft
Est. Value
About This Home
This home is located at 58 Buckley Rd, West Dennis, MA 02670 and is currently estimated at $1,892,044, approximately $549 per square foot. 58 Buckley Rd is a home located in Barnstable County with nearby schools including Dennis-Yarmouth Regional High School and St. Pius X. School.
Ownership History
Date
Name
Owned For
Owner Type
Purchase Details
Closed on
Dec 3, 2021
Sold by
Odonnell Susan
Bought by
Susan Odonnell Ret
Current Estimated Value
Purchase Details
Closed on
Oct 15, 2021
Sold by
Caligari Linda A and Odonnell Nancy G
Bought by
Odonnell Susan
Purchase Details
Closed on
Dec 20, 2012
Sold by
Jnod Nt and Odonnell John W
Bought by
Caligari Linda A and Odonnell Nancy G
Purchase Details
Closed on
Feb 14, 2008
Sold by
Odonnell Diane and Odonnell James S
Bought by
Jnod Nt and Odonnell John W
Create a Home Valuation Report for This Property
The Home Valuation Report is an in-depth analysis detailing your home's value as well as a comparison with similar homes in the area
Home Values in the Area
Average Home Value in this Area
Purchase History
| Date | Buyer | Sale Price | Title Company |
|---|---|---|---|
| Susan Odonnell Ret | -- | None Available | |
| Odonnell Susan | -- | None Available | |
| Caligari Linda A | -- | -- | |
| Jnod Nt | -- | -- |
Source: Public Records
Tax History Compared to Growth
Tax History
| Year | Tax Paid | Tax Assessment Tax Assessment Total Assessment is a certain percentage of the fair market value that is determined by local assessors to be the total taxable value of land and additions on the property. | Land | Improvement |
|---|---|---|---|---|
| 2025 | $7,611 | $1,757,700 | $729,800 | $1,027,900 |
| 2024 | $7,426 | $1,691,500 | $701,900 | $989,600 |
| 2023 | $7,181 | $1,537,700 | $638,000 | $899,700 |
| 2022 | $6,472 | $1,155,800 | $486,900 | $668,900 |
| 2021 | $6,346 | $1,052,400 | $477,300 | $575,100 |
| 2020 | $10,166 | $1,019,300 | $477,300 | $542,000 |
| 2019 | $5,786 | $937,700 | $468,000 | $469,700 |
| 2018 | $9,293 | $900,000 | $445,500 | $454,500 |
| 2017 | $5,535 | $900,000 | $445,500 | $454,500 |
| 2016 | $5,806 | $889,200 | $501,200 | $388,000 |
| 2015 | $5,691 | $889,200 | $501,200 | $388,000 |
| 2014 | $5,569 | $877,000 | $501,200 | $375,800 |
Source: Public Records
Map
Nearby Homes
- 2 Rita Mary Way
- 181 Pleasant St
- 14 Schoolhouse Ln
- 308 Old Main St
- 745 Willow St
- 209 Main St Unit 3
- 209 Main St Unit 6
- 209 Main St Unit 1
- 209 Main St Unit 2
- 209 Main St Unit 4
- 209 Main St Unit 5
- 178 School St
- 45 Seth Ln
- 40 Kelley Rd
- 23 Doric Ave
- 22 Powhatan Rd
- 17 South St
- 29 Bass River Rd
- 15 Sharon Rd
- 401 Main St Unit 201