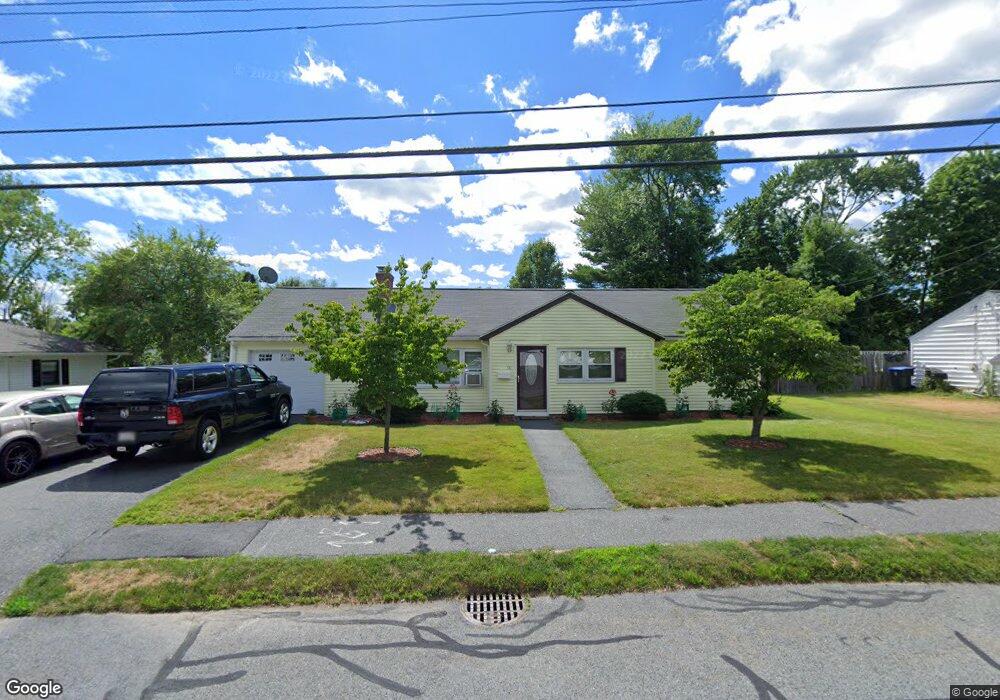
58 Charles St Natick, MA 01760
Estimated Value: $699,091 - $816,000
3
Beds
1
Bath
1,084
Sq Ft
$715/Sq Ft
Est. Value
About This Home
This home is located at 58 Charles St, Natick, MA 01760 and is currently estimated at $775,023, approximately $714 per square foot. 58 Charles St is a home located in Middlesex County with nearby schools including Natick High School, Wilson Middle School, and Bennett-Hemenway (Ben-Hem) Elementary School.
Ownership History
Date
Name
Owned For
Owner Type
Purchase Details
Closed on
Sep 4, 2025
Sold by
Bmr-58 Charles Street Llc
Bought by
Bos Office 5 Llc
Current Estimated Value
Purchase Details
Closed on
Dec 28, 2011
Sold by
Georgiopoulos Andreas and Kosmopoulos Eline
Bought by
Georgiopoulos Andreas and Georgiopoulos Eleni
Purchase Details
Closed on
May 1, 1998
Sold by
Georgiopoulos Andreas and Georgiopoulos John
Bought by
Georgiopoulos Andreas and Kosmopoulos Eline
Home Financials for this Owner
Home Financials are based on the most recent Mortgage that was taken out on this home.
Original Mortgage
$82,600
Interest Rate
7.04%
Mortgage Type
Purchase Money Mortgage
Create a Home Valuation Report for This Property
The Home Valuation Report is an in-depth analysis detailing your home's value as well as a comparison with similar homes in the area
Home Values in the Area
Average Home Value in this Area
Purchase History
| Date | Buyer | Sale Price | Title Company |
|---|---|---|---|
| Bos Office 5 Llc | $53,000,000 | -- | |
| Georgiopoulos Andreas | -- | -- | |
| Georgiopoulos Andreas | -- | -- | |
| Georgiopoulos Andreas | $30,000 | -- | |
| Georgiopoulos Andreas | $30,000 | -- |
Source: Public Records
Mortgage History
| Date | Status | Borrower | Loan Amount |
|---|---|---|---|
| Previous Owner | Georgiopoulos Andreas | $82,600 |
Source: Public Records
Tax History Compared to Growth
Tax History
| Year | Tax Paid | Tax Assessment Tax Assessment Total Assessment is a certain percentage of the fair market value that is determined by local assessors to be the total taxable value of land and additions on the property. | Land | Improvement |
|---|---|---|---|---|
| 2025 | $7,337 | $613,500 | $450,200 | $163,300 |
| 2024 | $7,106 | $579,600 | $425,200 | $154,400 |
| 2023 | $6,949 | $549,800 | $400,100 | $149,700 |
| 2022 | $6,735 | $504,900 | $365,100 | $139,800 |
| 2021 | $4,354 | $476,600 | $345,100 | $131,500 |
| 2020 | $6,282 | $461,600 | $330,100 | $131,500 |
| 2019 | $5,273 | $414,900 | $330,100 | $84,800 |
| 2018 | $4,693 | $359,600 | $300,100 | $59,500 |
| 2017 | $4,419 | $327,600 | $265,100 | $62,500 |
| 2016 | $4,234 | $312,000 | $250,100 | $61,900 |
| 2015 | $4,157 | $300,800 | $250,100 | $50,700 |
Source: Public Records
Map
Nearby Homes
- 7 Jackson Ct Unit B
- 12 Linden St
- 287 Bacon St
- 293 Bacon St Unit A
- 58 N Main St Unit 304
- 34 N Main St Unit 2
- 4 Willow St
- 2 Yuba Place
- 28 Walnut St
- 8 Flynn St
- 26 Walnut St
- 20 Florence St Unit B
- 8 Stanley St
- 16 Harvard St
- 25 Sawin St
- 13 Sheffield Rd
- 7 Sheffield Rd
- 49 Summer St
- 4 Richard Rd
- 25 Irving Rd