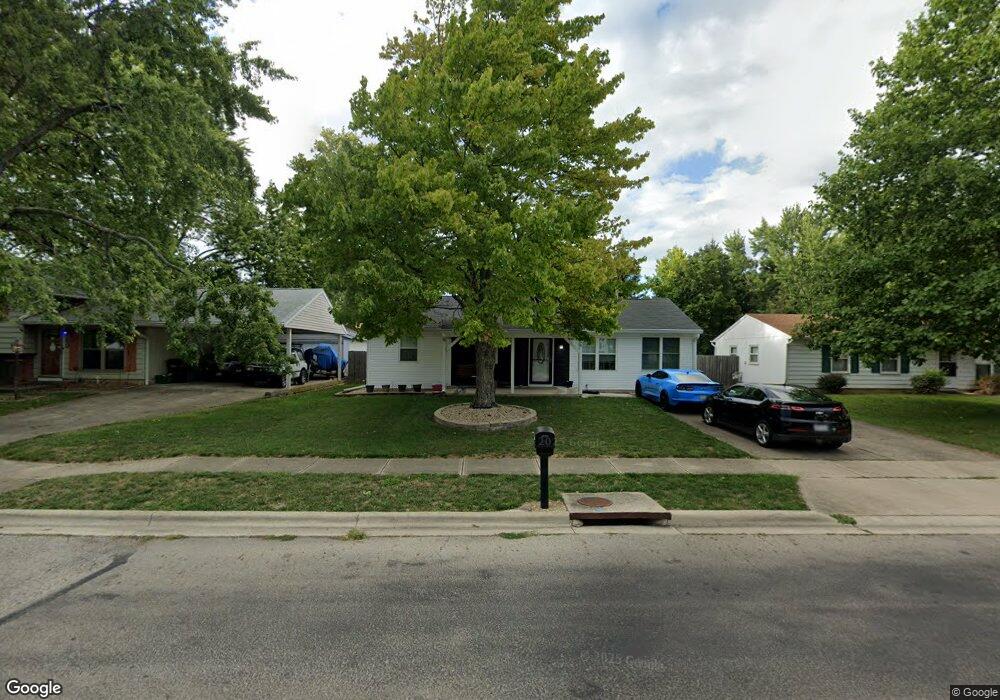
58 Cherry St Groveport, OH 43125
Estimated Value: $216,000 - $249,000
3
Beds
1
Bath
1,175
Sq Ft
$195/Sq Ft
Est. Value
About This Home
This home is located at 58 Cherry St, Groveport, OH 43125 and is currently estimated at $229,454, approximately $195 per square foot. 58 Cherry St is a home located in Franklin County with nearby schools including Groveport Madison High School, Groveport Community School, and Madison Christian School.
Ownership History
Date
Name
Owned For
Owner Type
Purchase Details
Closed on
Sep 14, 2021
Sold by
Kell Kimberly
Bought by
Kell Kimberly and Mckinney Gregory
Current Estimated Value
Purchase Details
Closed on
Dec 29, 2016
Sold by
Bowman Virgil and Bowman Virgil D
Bought by
Lell Kimberly
Purchase Details
Closed on
Feb 7, 2003
Sold by
Skaggs Albert E and Skaggs Suzanne L
Bought by
Bowman Virgil and Bowman Nancy
Purchase Details
Closed on
Dec 22, 1988
Bought by
Skaggs Albert E
Create a Home Valuation Report for This Property
The Home Valuation Report is an in-depth analysis detailing your home's value as well as a comparison with similar homes in the area
Home Values in the Area
Average Home Value in this Area
Purchase History
| Date | Buyer | Sale Price | Title Company |
|---|---|---|---|
| Kell Kimberly | -- | None Available | |
| Lell Kimberly | $100,000 | Title Source Inc | |
| Bowman Virgil | $41,000 | -- | |
| Skaggs Albert E | $41,000 | -- |
Source: Public Records
Tax History Compared to Growth
Tax History
| Year | Tax Paid | Tax Assessment Tax Assessment Total Assessment is a certain percentage of the fair market value that is determined by local assessors to be the total taxable value of land and additions on the property. | Land | Improvement |
|---|---|---|---|---|
| 2024 | $3,422 | $69,970 | $21,350 | $48,620 |
| 2023 | $3,392 | $69,965 | $21,350 | $48,615 |
| 2022 | $2,512 | $41,340 | $8,790 | $32,550 |
| 2021 | $2,521 | $41,340 | $8,790 | $32,550 |
| 2020 | $2,527 | $41,340 | $8,790 | $32,550 |
| 2019 | $2,411 | $34,760 | $7,320 | $27,440 |
| 2018 | $1,212 | $34,760 | $7,320 | $27,440 |
| 2017 | $1,640 | $34,170 | $7,320 | $26,850 |
| 2016 | $1,503 | $28,280 | $7,070 | $21,210 |
| 2015 | $758 | $28,280 | $7,070 | $21,210 |
| 2014 | $1,427 | $28,280 | $7,070 | $21,210 |
| 2013 | $656 | $29,785 | $7,455 | $22,330 |
Source: Public Records
Map
Nearby Homes