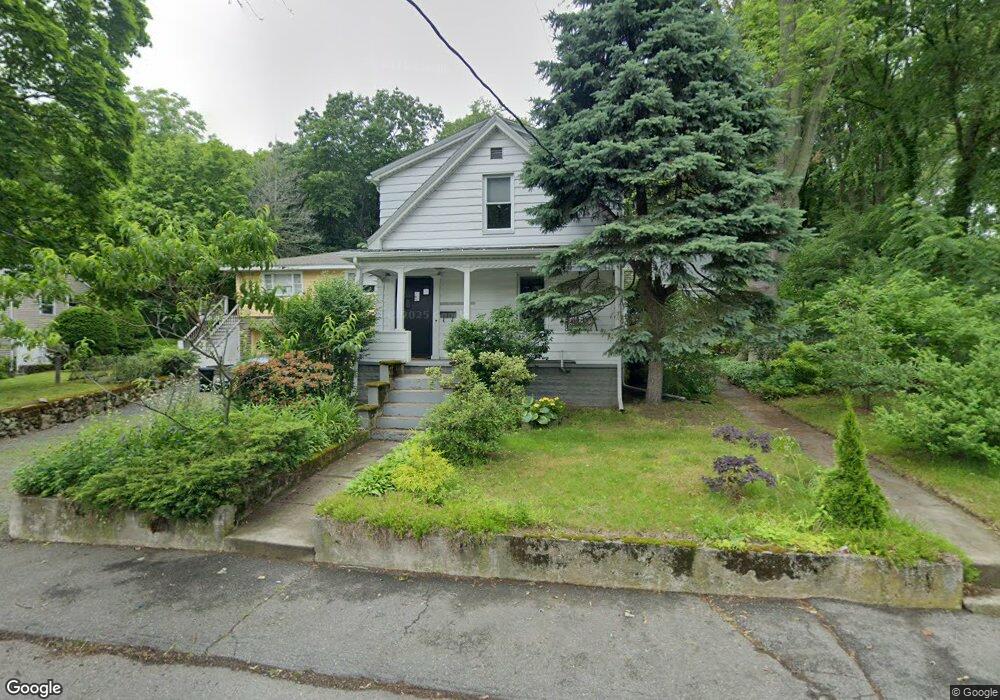
58 Cherry St Swampscott, MA 01907
Estimated Value: $566,000 - $636,000
3
Beds
2
Baths
1,335
Sq Ft
$449/Sq Ft
Est. Value
About This Home
This home is located at 58 Cherry St, Swampscott, MA 01907 and is currently estimated at $599,789, approximately $449 per square foot. 58 Cherry St is a home located in Essex County with nearby schools including Swampscott Middle School and Swampscott High School.
Ownership History
Date
Name
Owned For
Owner Type
Purchase Details
Closed on
Feb 22, 2002
Sold by
Difronzo Nicolena Est
Bought by
Jefferies Thomas W and Jefferies Catherine M
Current Estimated Value
Home Financials for this Owner
Home Financials are based on the most recent Mortgage that was taken out on this home.
Original Mortgage
$187,920
Interest Rate
7.08%
Mortgage Type
Purchase Money Mortgage
Create a Home Valuation Report for This Property
The Home Valuation Report is an in-depth analysis detailing your home's value as well as a comparison with similar homes in the area
Home Values in the Area
Average Home Value in this Area
Purchase History
| Date | Buyer | Sale Price | Title Company |
|---|---|---|---|
| Jefferies Thomas W | $234,900 | -- | |
| Jefferies Thomas W | $234,900 | -- |
Source: Public Records
Mortgage History
| Date | Status | Borrower | Loan Amount |
|---|---|---|---|
| Open | Jefferies Thomas W | $188,000 | |
| Closed | Jefferies Thomas W | $187,920 |
Source: Public Records
Tax History
| Year | Tax Paid | Tax Assessment Tax Assessment Total Assessment is a certain percentage of the fair market value that is determined by local assessors to be the total taxable value of land and additions on the property. | Land | Improvement |
|---|---|---|---|---|
| 2025 | $5,553 | $484,100 | $234,700 | $249,400 |
| 2024 | $5,441 | $473,500 | $223,500 | $250,000 |
| 2023 | $5,223 | $444,900 | $207,000 | $237,900 |
| 2022 | $5,000 | $389,700 | $182,100 | $207,600 |
| 2021 | $4,743 | $343,700 | $140,700 | $203,000 |
| 2020 | $4,756 | $332,600 | $132,500 | $200,100 |
| 2019 | $4,803 | $316,000 | $115,900 | $200,100 |
| 2018 | $4,810 | $300,600 | $115,900 | $184,700 |
| 2017 | $4,687 | $268,600 | $99,300 | $169,300 |
| 2016 | $4,296 | $247,900 | $78,600 | $169,300 |
| 2015 | $4,251 | $247,900 | $78,600 | $169,300 |
| 2014 | $4,037 | $215,900 | $56,300 | $159,600 |
Source: Public Records
Map
Nearby Homes
- 96 Burpee Rd Unit 1
- 13 Roy St Unit 3
- 60 Roy St
- 70 Mudge St Unit 12
- 185 Burrill St
- 146 Burrill St
- 143 Burrill St Unit 301
- 11 Boynton St Unit 104
- 11 Boynton St Unit 101
- 11 Boynton St Unit 103
- 11 Boynton St Unit 201
- 33A Jackson St Unit 303
- 6 Elmwood Rd
- 141 Essex St
- 6 Nantucket Ave
- 30 Clifton Ave
- 28 Claremont Terrace Unit 6
- 26 Valley Rd
- 16 Clinton St
- 55 Addison Ave
- 54 Cherry St
- 50 Cherry St
- 65 Cherry St
- 61 Cherry St Unit 63
- 61 Cherry St Unit 1
- 61-63 Cherry St Unit 3
- 61 Cherry St Unit 2
- 63 Cherry St Unit 2
- 61-63 Cherry St
- 19 Spinale Rd
- 46 Cherry St Unit B
- 46 Cherry St Unit A
- 69 Cherry St
- 42 Cherry St
- 42 Cherry St Unit A
- 44 Cherry St Unit 4
- 44 Cherry St Unit 4
- 44 Cherry St Unit 3
- 44 Cherry St Unit 1
- 50 Essex St
Your Personal Tour Guide
Ask me questions while you tour the home.