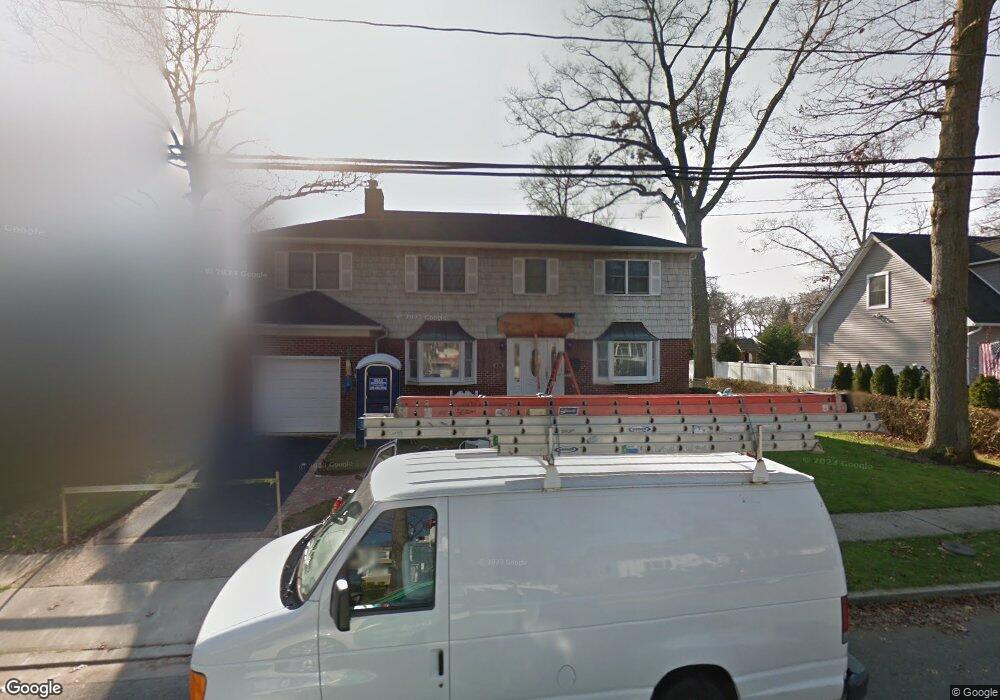
58 Chestnut St Massapequa, NY 11758
Estimated Value: $791,763 - $961,000
--
Bed
3
Baths
2,354
Sq Ft
$372/Sq Ft
Est. Value
About This Home
This home is located at 58 Chestnut St, Massapequa, NY 11758 and is currently estimated at $876,382, approximately $372 per square foot. 58 Chestnut St is a home located in Nassau County with nearby schools including Massapequa High School - Ames Campus, Berner Middle School, and Massapequa High School.
Ownership History
Date
Name
Owned For
Owner Type
Purchase Details
Closed on
Sep 20, 2017
Sold by
Crotty John T
Bought by
Teichman Bryan P and Teichman Corinne A
Current Estimated Value
Home Financials for this Owner
Home Financials are based on the most recent Mortgage that was taken out on this home.
Original Mortgage
$592,312
Outstanding Balance
$494,090
Interest Rate
3.86%
Mortgage Type
VA
Estimated Equity
$382,292
Purchase Details
Closed on
Apr 24, 2017
Sold by
Crotty John T and Crotty Samantha
Bought by
Crotty John T
Create a Home Valuation Report for This Property
The Home Valuation Report is an in-depth analysis detailing your home's value as well as a comparison with similar homes in the area
Home Values in the Area
Average Home Value in this Area
Purchase History
| Date | Buyer | Sale Price | Title Company |
|---|---|---|---|
| Teichman Bryan P | $650,000 | None Available | |
| Crotty John T | -- | Fidelity National Title Insu |
Source: Public Records
Mortgage History
| Date | Status | Borrower | Loan Amount |
|---|---|---|---|
| Open | Teichman Bryan P | $592,312 |
Source: Public Records
Tax History Compared to Growth
Tax History
| Year | Tax Paid | Tax Assessment Tax Assessment Total Assessment is a certain percentage of the fair market value that is determined by local assessors to be the total taxable value of land and additions on the property. | Land | Improvement |
|---|---|---|---|---|
| 2025 | $16,924 | $594 | $199 | $395 |
| 2024 | $4,858 | $573 | $192 | $381 |
| 2023 | $16,787 | $629 | $217 | $412 |
| 2022 | $16,787 | $594 | $199 | $395 |
| 2021 | $15,207 | $623 | $209 | $414 |
| 2020 | $16,532 | $884 | $701 | $183 |
| 2019 | $4,746 | $884 | $701 | $183 |
| 2018 | $7,906 | $884 | $0 | $0 |
| 2017 | $7,906 | $940 | $542 | $398 |
| 2016 | $12,479 | $1,216 | $701 | $515 |
| 2015 | $5,309 | $1,216 | $701 | $515 |
| 2014 | $5,309 | $1,216 | $701 | $515 |
| 2013 | $4,526 | $1,213 | $701 | $512 |
Source: Public Records
Map
Nearby Homes
- 54 Chestnut St
- 17 Linden St
- 28 Grove St
- 63 Pennsylvania Ave
- 1872 Park Dr
- 3969 Marlow Ct
- 4037 Park Dr
- 36 Michigan Ave
- 3945 Hickory St
- 51 Michigan Ave
- 2067 Jackson Ave
- 5675 Merrick Rd
- 104 Clark Ave
- 4060 Clark St
- 3861 Hickory St
- 243 Seaford Ave
- 37 Lakeshore Blvd
- 3937 John Ln
- 4 Sutton Place
- 230 W End Ave