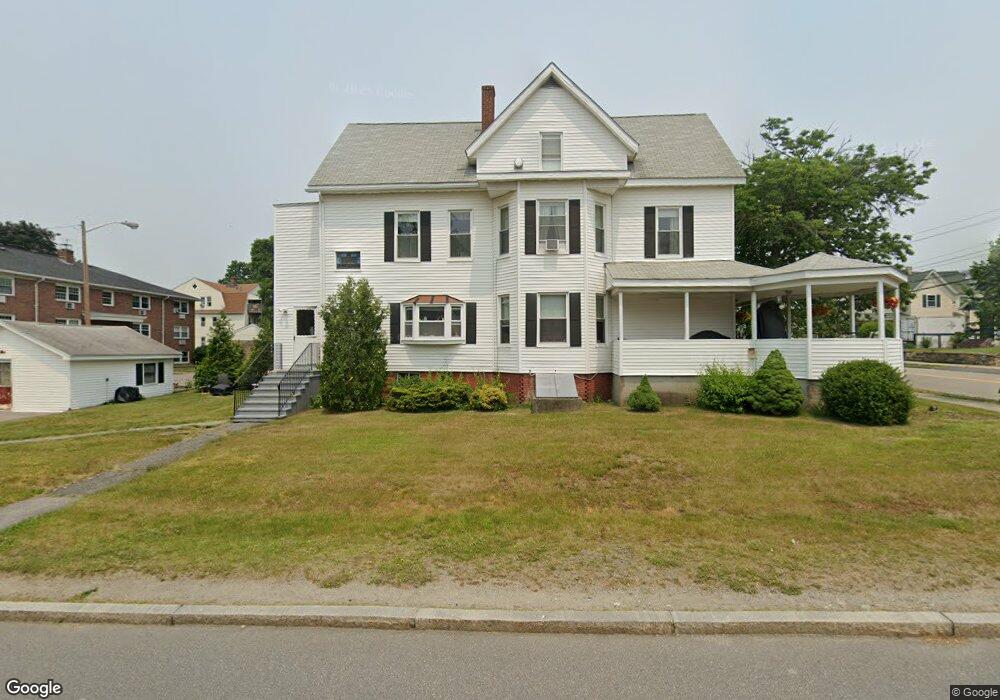
58 Coburn Ave Unit 3 Worcester, MA 01604
Lake Park NeighborhoodEstimated Value: $611,000 - $702,000
2
Beds
1
Bath
800
Sq Ft
$810/Sq Ft
Est. Value
About This Home
This home is located at 58 Coburn Ave Unit 3, Worcester, MA 01604 and is currently estimated at $648,352, approximately $810 per square foot. 58 Coburn Ave Unit 3 is a home located in Worcester County with nearby schools including Jacob Hiatt Magnet School, Chandler Magnet, and Lake View Elementary School.
Ownership History
Date
Name
Owned For
Owner Type
Purchase Details
Closed on
Aug 24, 2012
Sold by
Wyse Shawn M and Wyse Rosa M
Bought by
Srw Rt
Current Estimated Value
Purchase Details
Closed on
Jul 12, 2011
Sold by
Wyse Shawn M
Bought by
Wyse Shawn M and Wyse Rosa M
Home Financials for this Owner
Home Financials are based on the most recent Mortgage that was taken out on this home.
Original Mortgage
$233,300
Interest Rate
4.6%
Mortgage Type
Purchase Money Mortgage
Purchase Details
Closed on
Jan 31, 2006
Sold by
Cormier Ann F and Cormier Robert F
Bought by
Wyse Shawn M
Home Financials for this Owner
Home Financials are based on the most recent Mortgage that was taken out on this home.
Original Mortgage
$262,500
Interest Rate
6.34%
Mortgage Type
Purchase Money Mortgage
Create a Home Valuation Report for This Property
The Home Valuation Report is an in-depth analysis detailing your home's value as well as a comparison with similar homes in the area
Home Values in the Area
Average Home Value in this Area
Purchase History
| Date | Buyer | Sale Price | Title Company |
|---|---|---|---|
| Srw Rt | -- | -- | |
| Wyse Shawn M | -- | -- | |
| Wyse Shawn M | $350,000 | -- |
Source: Public Records
Mortgage History
| Date | Status | Borrower | Loan Amount |
|---|---|---|---|
| Previous Owner | Wyse Shawn M | $233,300 | |
| Previous Owner | Wyse Shawn M | $262,500 |
Source: Public Records
Tax History Compared to Growth
Tax History
| Year | Tax Paid | Tax Assessment Tax Assessment Total Assessment is a certain percentage of the fair market value that is determined by local assessors to be the total taxable value of land and additions on the property. | Land | Improvement |
|---|---|---|---|---|
| 2025 | $8,043 | $609,800 | $117,800 | $492,000 |
| 2024 | $7,862 | $571,800 | $117,800 | $454,000 |
| 2023 | $7,276 | $507,400 | $102,400 | $405,000 |
| 2022 | $6,540 | $430,000 | $82,000 | $348,000 |
| 2021 | $5,304 | $325,800 | $65,500 | $260,300 |
| 2020 | $4,663 | $274,300 | $65,600 | $208,700 |
| 2019 | $4,819 | $267,700 | $59,000 | $208,700 |
| 2018 | $4,901 | $259,200 | $59,000 | $200,200 |
| 2017 | $4,667 | $242,800 | $59,000 | $183,800 |
| 2016 | $3,906 | $189,500 | $42,900 | $146,600 |
| 2015 | $3,803 | $189,500 | $42,900 | $146,600 |
| 2014 | $3,703 | $189,500 | $42,900 | $146,600 |
Source: Public Records
Map
Nearby Homes
- 65 Lake Ave Unit 831
- 65 Lake Ave Unit 220
- 65 Lake Ave Unit 1008
- 47 Alvarado Ave Unit 1A
- 22 Sherbrook Ave
- 24 Sherbrook Ave
- 79 Alvarado Ave
- 13 Frank St
- 73 S Quinsigamond Ave
- 241 Lake Ave
- 22 Shrewsbury Green Dr Unit C
- 105 S Quinsigamond Ave
- 42 Shrewsbury Green Dr Unit I
- 42 Shrewsbury Green Dr Unit F
- 308 Plantation St
- 311 Plantation St
- 270 Coburn Ave
- 2 Touraine St
- 46 Dominion Rd
- 190 Dominion Rd
- 58 Coburn Ave
- 64 Coburn Ave
- 50 Coburn Ave
- 57 Coburn Ave Unit 1
- 57 Coburn Ave Unit 4
- 57 Coburn Ave
- 53 Coburn Ave
- 68 Coburn Ave
- 61 Coburn Ave
- 46 Coburn Ave
- 37 Alvarado Ave
- 49 Coburn Ave
- 65 Coburn Ave
- 25 Alvarado Ave
- 72 Coburn Ave
- 69 Coburn Ave
- 42 Coburn Ave
- 41A Alvarado Ave
- 41 Alvarado Ave
- 23 Alvarado Ave