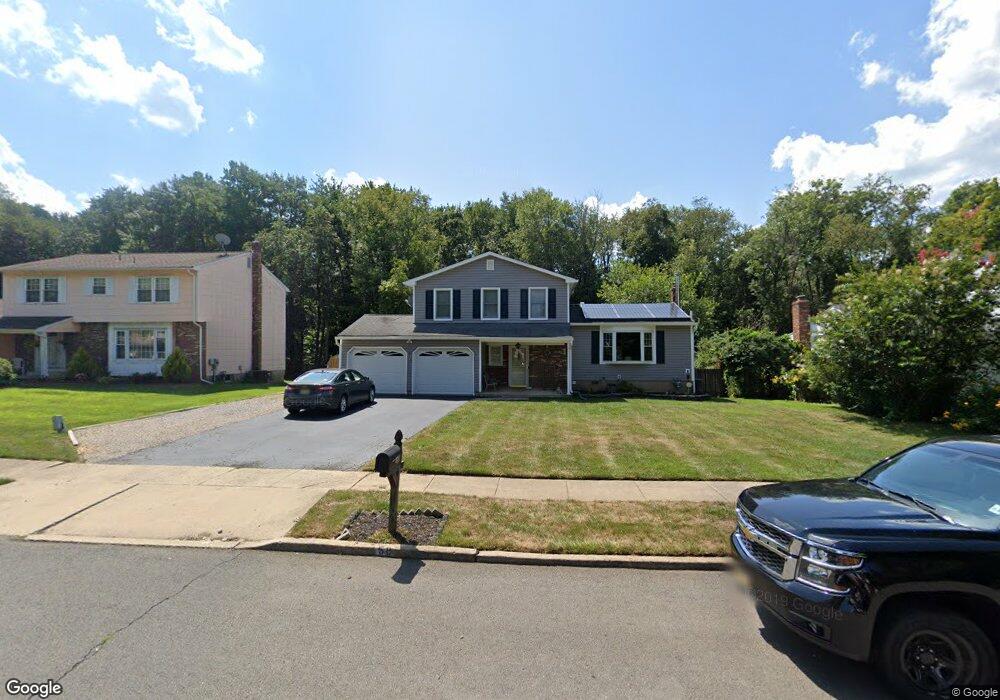
58 Colleen Cir Ewing, NJ 08638
Ewingville NeighborhoodEstimated Value: $464,565 - $514,000
Studio
--
Bath
1,721
Sq Ft
$281/Sq Ft
Est. Value
About This Home
This home is located at 58 Colleen Cir, Ewing, NJ 08638 and is currently estimated at $484,141, approximately $281 per square foot. 58 Colleen Cir is a home located in Mercer County with nearby schools including Ewing High School, Trenton Stem-To-Civics Charter School, and Guidepost Montessori at Lawrenceville.
Ownership History
Date
Name
Owned For
Owner Type
Purchase Details
Closed on
Sep 26, 2003
Sold by
Gardina Craig
Bought by
Stemler John and Stemler Amy
Current Estimated Value
Home Financials for this Owner
Home Financials are based on the most recent Mortgage that was taken out on this home.
Original Mortgage
$251,900
Interest Rate
5.9%
Purchase Details
Closed on
Jul 10, 1998
Sold by
Tubbs Alan
Bought by
Gardina Craig and Gardina Melanie
Home Financials for this Owner
Home Financials are based on the most recent Mortgage that was taken out on this home.
Original Mortgage
$151,050
Interest Rate
7.02%
Purchase Details
Closed on
Oct 24, 1994
Sold by
Kasprzak Thomas
Bought by
Tubbs Alan and Tubbs Christine
Home Financials for this Owner
Home Financials are based on the most recent Mortgage that was taken out on this home.
Original Mortgage
$159,000
Interest Rate
8.65%
Mortgage Type
VA
Create a Home Valuation Report for This Property
The Home Valuation Report is an in-depth analysis detailing your home's value as well as a comparison with similar homes in the area
Home Values in the Area
Average Home Value in this Area
Purchase History
| Date | Buyer | Sale Price | Title Company |
|---|---|---|---|
| Stemler John | $279,900 | -- | |
| Gardina Craig | $159,000 | -- | |
| Tubbs Alan | $155,000 | -- |
Source: Public Records
Mortgage History
| Date | Status | Borrower | Loan Amount |
|---|---|---|---|
| Previous Owner | Stemler John | $251,900 | |
| Previous Owner | Gardina Craig | $151,050 | |
| Previous Owner | Tubbs Alan | $159,000 |
Source: Public Records
Tax History
| Year | Tax Paid | Tax Assessment Tax Assessment Total Assessment is a certain percentage of the fair market value that is determined by local assessors to be the total taxable value of land and additions on the property. | Land | Improvement |
|---|---|---|---|---|
| 2025 | $9,325 | $237,100 | $77,800 | $159,300 |
| 2024 | $8,766 | $237,100 | $77,800 | $159,300 |
Source: Public Records
Map
Nearby Homes
- 438 Ewingville Rd
- 4 David Dr
- 347 Green Ln
- 2148 Pennington Rd
- 42 Running Brook Rd
- 71 Bakun Way
- 34 Lopatcong Dr
- 4 Blossom Dr
- 23 Sundew Dr
- 140 Crescent Ave
- 256 Ewingville Rd
- 40 Arden Ave
- 6 Van Gogh Ct
- 89 Upper Ferry Rd
- 53 Carlton Ave
- 138 Tulip Ln
- 2 Sparrow Ct
- 13 Hickory Hill Dr
- 200 Upland Ave
- 37 van Duyn Dr
Your Personal Tour Guide
Ask me questions while you tour the home.