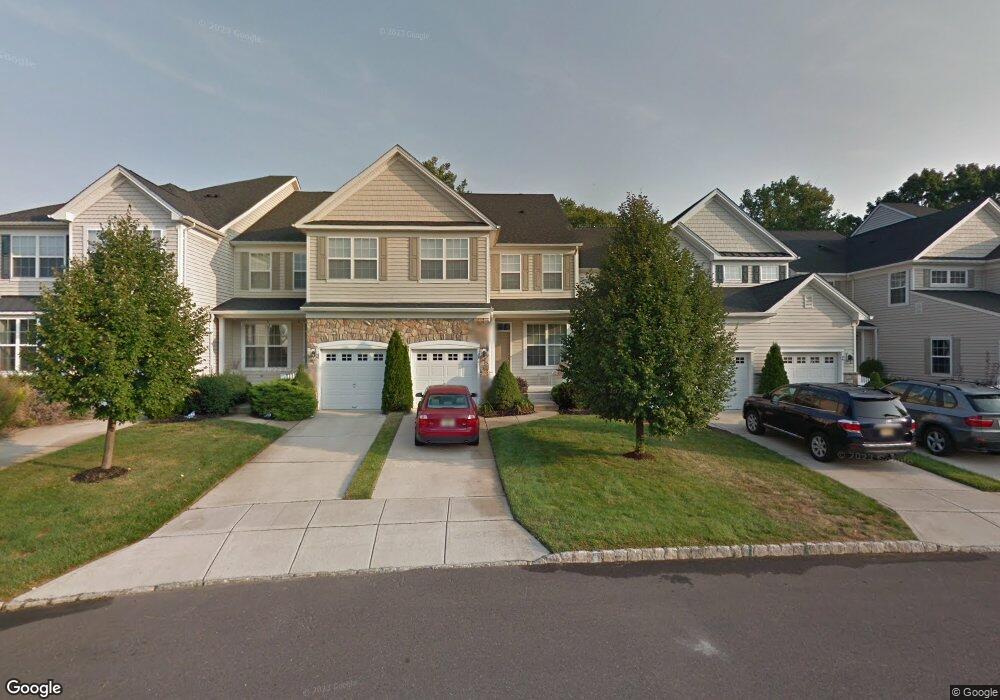
58 Compass Cir Mount Laurel, NJ 08054
Estimated Value: $495,620 - $609,000
Studio
--
Bath
2,276
Sq Ft
$244/Sq Ft
Est. Value
About This Home
This home is located at 58 Compass Cir, Mount Laurel, NJ 08054 and is currently estimated at $555,655, approximately $244 per square foot. 58 Compass Cir is a home located in Burlington County with nearby schools including Fleetwood Elementary School, Mount Laurel Hartford School, and T.E. Harrington Middle School.
Ownership History
Date
Name
Owned For
Owner Type
Purchase Details
Closed on
Aug 26, 2015
Sold by
Rahn Elena M
Bought by
Molinari Paul J
Current Estimated Value
Home Financials for this Owner
Home Financials are based on the most recent Mortgage that was taken out on this home.
Original Mortgage
$250,000
Outstanding Balance
$197,425
Interest Rate
4.07%
Mortgage Type
New Conventional
Estimated Equity
$358,230
Purchase Details
Closed on
Feb 23, 2006
Sold by
Hovbros Rancocas Llc
Bought by
Rahn Elena M
Create a Home Valuation Report for This Property
The Home Valuation Report is an in-depth analysis detailing your home's value as well as a comparison with similar homes in the area
Home Values in the Area
Average Home Value in this Area
Purchase History
| Date | Buyer | Sale Price | Title Company |
|---|---|---|---|
| Molinari Paul J | $34,600 | Turnkey Title Llc | |
| Rahn Elena M | $424,973 | Certified Title Agency | |
| -- | $425,000 | -- |
Source: Public Records
Mortgage History
| Date | Status | Borrower | Loan Amount |
|---|---|---|---|
| Open | Molinari Paul J | $250,000 |
Source: Public Records
Tax History
| Year | Tax Paid | Tax Assessment Tax Assessment Total Assessment is a certain percentage of the fair market value that is determined by local assessors to be the total taxable value of land and additions on the property. | Land | Improvement |
|---|---|---|---|---|
| 2025 | $9,373 | $296,900 | $58,000 | $238,900 |
| 2024 | $9,020 | $296,900 | $58,000 | $238,900 |
| 2023 | $9,020 | $296,900 | $58,000 | $238,900 |
| 2022 | $8,990 | $296,900 | $58,000 | $238,900 |
| 2021 | $8,821 | $296,900 | $58,000 | $238,900 |
| 2020 | $8,649 | $296,900 | $58,000 | $238,900 |
| 2019 | $8,560 | $296,900 | $58,000 | $238,900 |
| 2018 | $8,494 | $296,900 | $58,000 | $238,900 |
| 2017 | $8,275 | $296,900 | $58,000 | $238,900 |
| 2016 | $8,150 | $296,900 | $58,000 | $238,900 |
| 2015 | $8,055 | $296,900 | $58,000 | $238,900 |
| 2014 | $7,975 | $296,900 | $58,000 | $238,900 |
Source: Public Records
Map
Nearby Homes
- 40 Compass Cir
- 861 Centerton Rd
- 10 Crows Nest Ct
- 31 Traynor Ln
- 5 Birch Dr
- 172 Tiffany Ln
- 512 Garden Way
- 11 Tempest Ln
- 101 Tiffany Ln
- 514 Foxwood Dr
- 15 Toledo Ln
- 601 Tallowood Ln
- 8 Catalpa Ln
- 45 Stratford Ln
- 950 Bortons Landing Rd
- 42 Tipton Ln
- 15 Tiber Ln
- 336 Larch Rd
- 12 Cove Rd
- 31 S John F. Kennedy Way
Your Personal Tour Guide
Ask me questions while you tour the home.