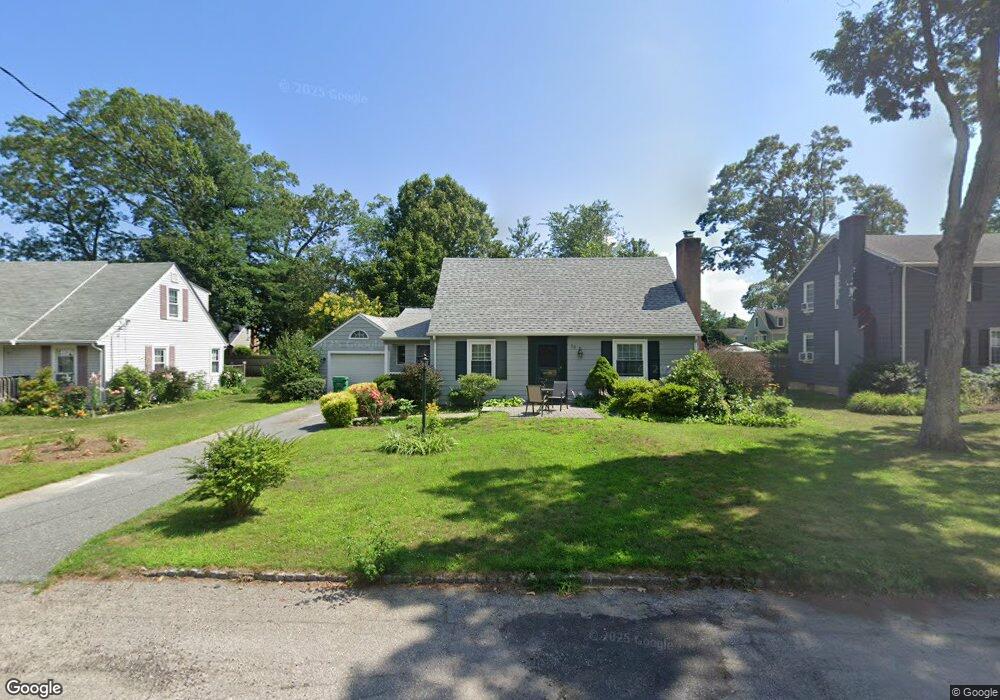
58 Edgehill Rd Warwick, RI 02889
Hoxie NeighborhoodEstimated Value: $438,194 - $484,000
3
Beds
2
Baths
1,357
Sq Ft
$336/Sq Ft
Est. Value
About This Home
This home is located at 58 Edgehill Rd, Warwick, RI 02889 and is currently estimated at $455,549, approximately $335 per square foot. 58 Edgehill Rd is a home located in Kent County with nearby schools including Saint Kevin School and Bishop Hendricken High School.
Ownership History
Date
Name
Owned For
Owner Type
Purchase Details
Closed on
Jun 30, 2016
Sold by
Lauda Susan A
Bought by
Lauda Susan A
Current Estimated Value
Purchase Details
Closed on
May 23, 1997
Sold by
Vaccaro Paul R and Vaccaro Richard P
Bought by
Lauda Susan A
Purchase Details
Closed on
Oct 18, 1991
Sold by
Cattoni Donald F
Bought by
Vaccaro Paul R
Create a Home Valuation Report for This Property
The Home Valuation Report is an in-depth analysis detailing your home's value as well as a comparison with similar homes in the area
Home Values in the Area
Average Home Value in this Area
Purchase History
| Date | Buyer | Sale Price | Title Company |
|---|---|---|---|
| Lauda Susan A | -- | -- | |
| Lauda Susan A | $118,000 | -- | |
| Vaccaro Paul R | $125,000 | -- | |
| Vaccaro Paul R | $125,000 | -- |
Source: Public Records
Mortgage History
| Date | Status | Borrower | Loan Amount |
|---|---|---|---|
| Previous Owner | Vaccaro Paul R | $140,000 | |
| Previous Owner | Vaccaro Paul R | $50,000 | |
| Previous Owner | Vaccaro Paul R | $25,000 |
Source: Public Records
Tax History
| Year | Tax Paid | Tax Assessment Tax Assessment Total Assessment is a certain percentage of the fair market value that is determined by local assessors to be the total taxable value of land and additions on the property. | Land | Improvement |
|---|---|---|---|---|
| 2025 | $4,930 | $388,200 | $107,600 | $280,600 |
| 2024 | $4,528 | $312,900 | $93,600 | $219,300 |
| 2023 | $4,440 | $312,900 | $93,600 | $219,300 |
| 2022 | $4,372 | $233,400 | $66,400 | $167,000 |
| 2021 | $4,372 | $233,400 | $66,400 | $167,000 |
| 2020 | $4,372 | $233,400 | $66,400 | $167,000 |
| 2019 | $4,372 | $233,400 | $66,400 | $167,000 |
| 2018 | $4,060 | $195,200 | $66,400 | $128,800 |
| 2017 | $3,951 | $195,200 | $66,400 | $128,800 |
| 2016 | $3,951 | $195,200 | $66,400 | $128,800 |
| 2015 | $3,496 | $168,500 | $59,200 | $109,300 |
| 2014 | $3,380 | $168,500 | $59,200 | $109,300 |
| 2013 | $3,335 | $168,500 | $59,200 | $109,300 |
Source: Public Records
Map
Nearby Homes
Your Personal Tour Guide
Ask me questions while you tour the home.