Estimated Value: $361,000 - $440,000
3
Beds
2
Baths
2,212
Sq Ft
$180/Sq Ft
Est. Value
About This Home
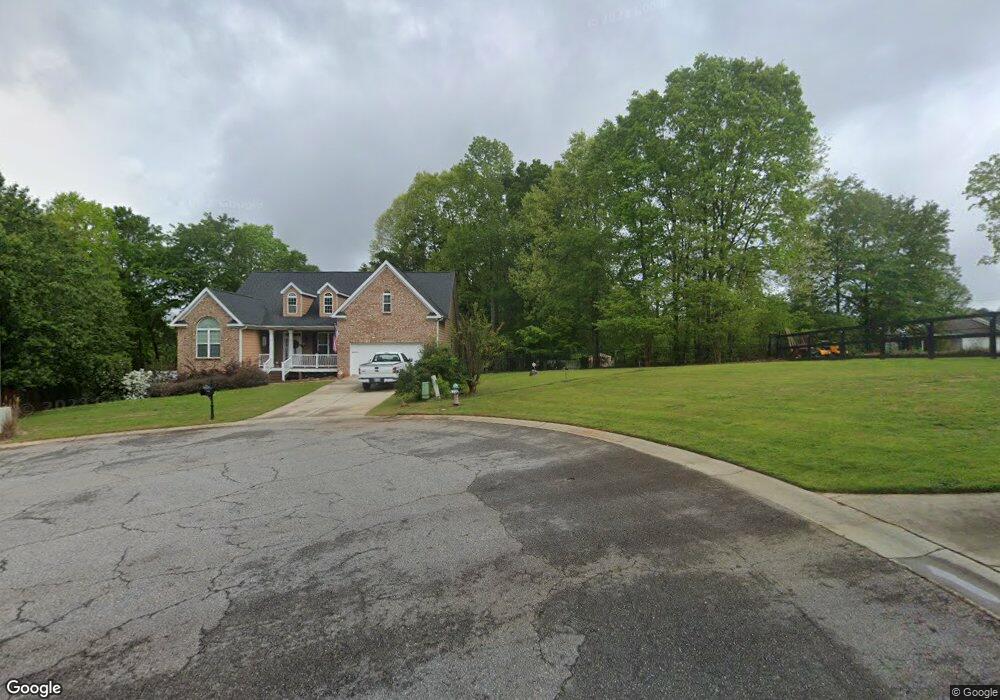
This home is located at 58 Glenn Ct, Hull, GA 30646 and is currently estimated at $397,185, approximately $179 per square foot. 58 Glenn Ct is a home located in Madison County with nearby schools including Madison County High School.
Ownership History
Date
Name
Owned For
Owner Type
Purchase Details
Closed on
Aug 31, 2006
Sold by
Robinson Joel B
Bought by
Ganey Regina and Ganey Lenton
Current Estimated Value
Home Financials for this Owner
Home Financials are based on the most recent Mortgage that was taken out on this home.
Original Mortgage
$145,000
Outstanding Balance
$86,650
Interest Rate
6.58%
Mortgage Type
New Conventional
Estimated Equity
$310,535
Purchase Details
Closed on
Jun 30, 2006
Sold by
The Community Bank
Bought by
Robinson Joel B and Robinson Beebe T
Home Financials for this Owner
Home Financials are based on the most recent Mortgage that was taken out on this home.
Original Mortgage
$180,000
Interest Rate
6.6%
Mortgage Type
New Conventional
Purchase Details
Closed on
May 12, 2006
Sold by
Dupree Investments Inc
Bought by
The Community Bank
Home Financials for this Owner
Home Financials are based on the most recent Mortgage that was taken out on this home.
Original Mortgage
$180,000
Interest Rate
6.6%
Mortgage Type
New Conventional
Create a Home Valuation Report for This Property
The Home Valuation Report is an in-depth analysis detailing your home's value as well as a comparison with similar homes in the area
Home Values in the Area
Average Home Value in this Area
Purchase History
| Date | Buyer | Sale Price | Title Company |
|---|---|---|---|
| Ganey Regina | $215,000 | -- | |
| Robinson Joel B | $175,825 | -- | |
| The Community Bank | $508,077 | -- |
Source: Public Records
Mortgage History
| Date | Status | Borrower | Loan Amount |
|---|---|---|---|
| Open | Ganey Regina | $145,000 | |
| Previous Owner | Robinson Joel B | $180,000 |
Source: Public Records
Tax History Compared to Growth
Tax History
| Year | Tax Paid | Tax Assessment Tax Assessment Total Assessment is a certain percentage of the fair market value that is determined by local assessors to be the total taxable value of land and additions on the property. | Land | Improvement |
|---|---|---|---|---|
| 2024 | $976 | $152,922 | $12,000 | $140,922 |
| 2023 | $4,662 | $145,204 | $12,000 | $133,204 |
| 2022 | $777 | $129,530 | $12,000 | $117,530 |
| 2021 | $82 | $103,457 | $12,000 | $91,457 |
| 2020 | $422 | $103,457 | $12,000 | $91,457 |
| 2019 | $77 | $88,000 | $10,392 | $77,608 |
| 2018 | $227 | $88,000 | $10,392 | $77,608 |
| 2017 | $3,046 | $101,617 | $12,000 | $89,617 |
| 2016 | $327 | $84,608 | $12,000 | $72,608 |
| 2015 | $425 | $84,608 | $12,000 | $72,608 |
| 2014 | $228 | $75,150 | $12,000 | $63,150 |
| 2013 | -- | $75,150 | $12,000 | $63,150 |
Source: Public Records
Map
Nearby Homes
- 0 Virginia Ln Unit Lot 15 CL336098
- 0 Virginia Ln Unit LOT 15 10579204
- 0 Spratlin Mill Rd Unit 1025918
- 0 Spratlin Mill Rd Unit 10526335
- 838 Virginia Ln
- 1309 Hull Rd
- 0 Woodland Creek Place Unit 10421130
- 300 Harve Mathis Rd
- 525 Virginia Ln
- 151 Rolling Woods Ln
- 540 & 542 Harve Mathis Rd
- 181 Bedford Dr
- 685 Bedford Dr
- 481 Bedford Dr
- 136 Wellington Dr
- 0 Spratlin Mill Dr Unit 7665837
- 0 Spratlin Mill Dr Unit LOT 14-C
- 336 Old Pittard Rd
- 1329 Spratlin Mill Dr
- 71 Glenn Ct
- 66 Glenn Ct
- 44 Glenn Ct
- 55 Hidden Falls Dr
- 231 Glenn Carrie Rd
- 207 Glenn Carrie Rd
- 95 Hidden Falls Dr
- 0 Glenn Ct Unit 8048937
- 0 Glenn Ct
- 28 Glenn Ct
- 0 Carrie Ln Unit CM651539
- 0 Carrie Ln Unit 8389838
- 0 Carrie Ln Unit 8178633
- 0 Carrie Ln
- 00 Hidden Falls Dr
- Lot 9 Hidden Falls Dr
- 35 Hidden Falls Dr
- 140 Carrie Ln
- 36 Carrie Ln