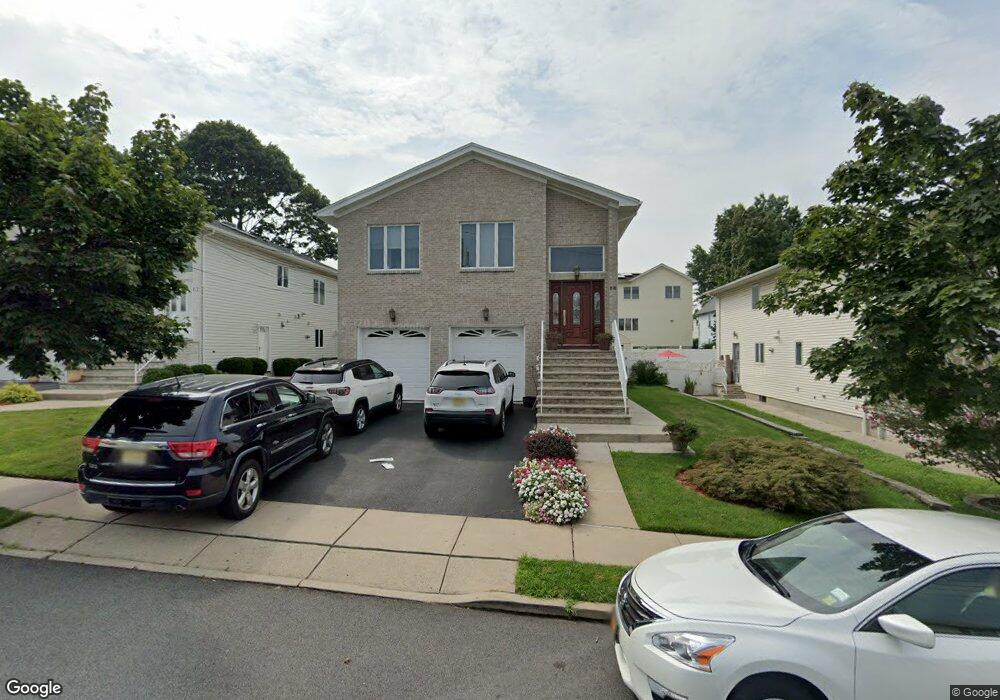
58 Grove St Elmwood Park, NJ 07407
Estimated Value: $818,245 - $1,046,000
--
Bed
--
Bath
3,000
Sq Ft
$314/Sq Ft
Est. Value
About This Home
This home is located at 58 Grove St, Elmwood Park, NJ 07407 and is currently estimated at $942,811, approximately $314 per square foot. 58 Grove St is a home located in Bergen County with nearby schools including Gilbert Avenue Elementary School, Elmwood Park Middle School, and Memorial Sr High School.
Ownership History
Date
Name
Owned For
Owner Type
Purchase Details
Closed on
Sep 19, 1997
Sold by
Martinoski Ljubomir
Bought by
Nicosia Giuseppe and Nicosia Maria
Current Estimated Value
Home Financials for this Owner
Home Financials are based on the most recent Mortgage that was taken out on this home.
Original Mortgage
$231,000
Outstanding Balance
$35,610
Interest Rate
7.41%
Estimated Equity
$907,201
Purchase Details
Closed on
Jun 17, 1996
Sold by
Terlizzi Evelyn
Bought by
Martinoski Ljubomir
Create a Home Valuation Report for This Property
The Home Valuation Report is an in-depth analysis detailing your home's value as well as a comparison with similar homes in the area
Home Values in the Area
Average Home Value in this Area
Purchase History
| Date | Buyer | Sale Price | Title Company |
|---|---|---|---|
| Nicosia Giuseppe | $308,000 | -- | |
| Martinoski Ljubomir | $103,750 | -- |
Source: Public Records
Mortgage History
| Date | Status | Borrower | Loan Amount |
|---|---|---|---|
| Open | Nicosia Giuseppe | $231,000 |
Source: Public Records
Tax History Compared to Growth
Tax History
| Year | Tax Paid | Tax Assessment Tax Assessment Total Assessment is a certain percentage of the fair market value that is determined by local assessors to be the total taxable value of land and additions on the property. | Land | Improvement |
|---|---|---|---|---|
| 2025 | $17,294 | $563,500 | $200,000 | $363,500 |
| 2024 | $16,860 | $563,500 | $200,000 | $363,500 |
| 2023 | $16,973 | $563,500 | $200,000 | $363,500 |
| 2022 | $16,973 | $563,500 | $200,000 | $363,500 |
| 2021 | $17,052 | $563,500 | $200,000 | $363,500 |
| 2020 | $16,916 | $563,500 | $200,000 | $363,500 |
| 2019 | $16,629 | $563,500 | $200,000 | $363,500 |
| 2018 | $16,471 | $563,500 | $200,000 | $363,500 |
| 2017 | $16,280 | $563,500 | $200,000 | $363,500 |
| 2016 | $15,941 | $563,500 | $200,000 | $363,500 |
| 2015 | $15,682 | $563,500 | $200,000 | $363,500 |
| 2014 | $15,209 | $563,500 | $200,000 | $363,500 |
Source: Public Records
Map
Nearby Homes
- 335 Elm St
- 355 Elm St
- 33 Chamberlain Ave
- 125 Orchard St
- 429 River Dr
- 50 van Riper Ave
- 189 Miller Ave
- 466 & 468 Market
- 204 Gilbert Ave
- 249 Orchard St
- 444-446 E 42nd St
- 163 Hillman Dr
- 179 Hillman Dr
- 91 Birchwood Dr
- 419-421 19th Ave
- 415 19th Ave Unit 417
- 43 Birchwood Dr
- 415-417 19th Ave
- 340 E 54th St
- 220 Hillman Dr