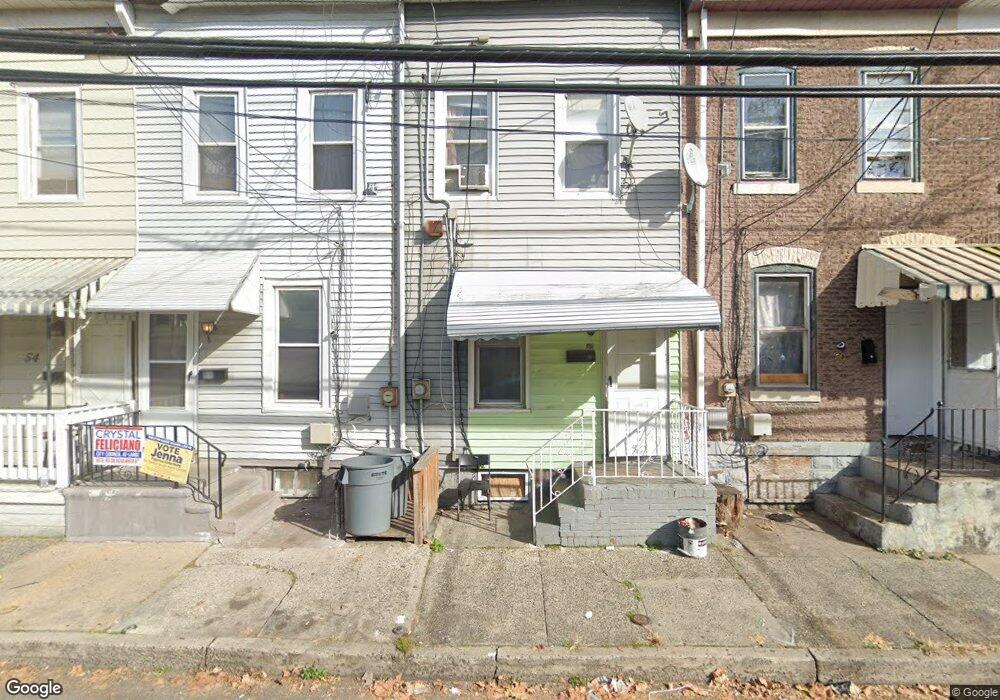
58 Hancock St Trenton, NJ 08611
South Trenton NeighborhoodEstimated Value: $142,718 - $190,000
2
Beds
1
Bath
936
Sq Ft
$179/Sq Ft
Est. Value
About This Home
This home is located at 58 Hancock St, Trenton, NJ 08611 and is currently estimated at $167,573, approximately $179 per square foot. 58 Hancock St is a home located in Mercer County with nearby schools including Mott Elementary School, Parker Elementary School, and Dr. Crosby Copeland Elementary School.
Ownership History
Date
Name
Owned For
Owner Type
Purchase Details
Closed on
Apr 4, 2022
Sold by
Helena Houses Llc
Bought by
Greenfeld Solomon
Current Estimated Value
Purchase Details
Closed on
Mar 29, 2022
Sold by
Nj Re Investments Llc
Bought by
Helena Houses Llc
Purchase Details
Closed on
May 7, 2019
Sold by
Lane Shirleyn and Pullen Shirleyn
Bought by
Echono Karen Igbe
Purchase Details
Closed on
Dec 13, 1999
Sold by
Quinones Juan
Bought by
Paul Shalita
Create a Home Valuation Report for This Property
The Home Valuation Report is an in-depth analysis detailing your home's value as well as a comparison with similar homes in the area
Home Values in the Area
Average Home Value in this Area
Purchase History
| Date | Buyer | Sale Price | Title Company |
|---|---|---|---|
| Greenfeld Solomon | $109,500 | Dekel Abstract | |
| Greenfeld Solomon | $109,500 | Dekel Abstract | |
| Helena Houses Llc | $67,000 | Dekel Abstract | |
| Nj Re Investments Llc | $40,000 | Dekel Abstract | |
| Echono Karen Igbe | $15,000 | None Available | |
| Paul Shalita | $20,000 | -- |
Source: Public Records
Tax History Compared to Growth
Tax History
| Year | Tax Paid | Tax Assessment Tax Assessment Total Assessment is a certain percentage of the fair market value that is determined by local assessors to be the total taxable value of land and additions on the property. | Land | Improvement |
|---|---|---|---|---|
| 2025 | $2,141 | $36,900 | $8,400 | $28,500 |
| 2024 | $2,054 | $36,900 | $8,400 | $28,500 |
| 2023 | $2,054 | $36,900 | $8,400 | $28,500 |
| 2022 | $2,014 | $36,900 | $8,400 | $28,500 |
| 2021 | $2,049 | $36,900 | $8,400 | $28,500 |
| 2020 | $2,042 | $36,900 | $8,400 | $28,500 |
| 2019 | $2,010 | $36,900 | $8,400 | $28,500 |
| 2018 | $1,924 | $36,900 | $8,400 | $28,500 |
| 2017 | $1,828 | $36,900 | $8,400 | $28,500 |
| 2016 | $2,439 | $42,400 | $14,700 | $27,700 |
| 2015 | $2,431 | $42,400 | $14,700 | $27,700 |
| 2014 | $2,419 | $42,400 | $14,700 | $27,700 |
Source: Public Records
Map
Nearby Homes