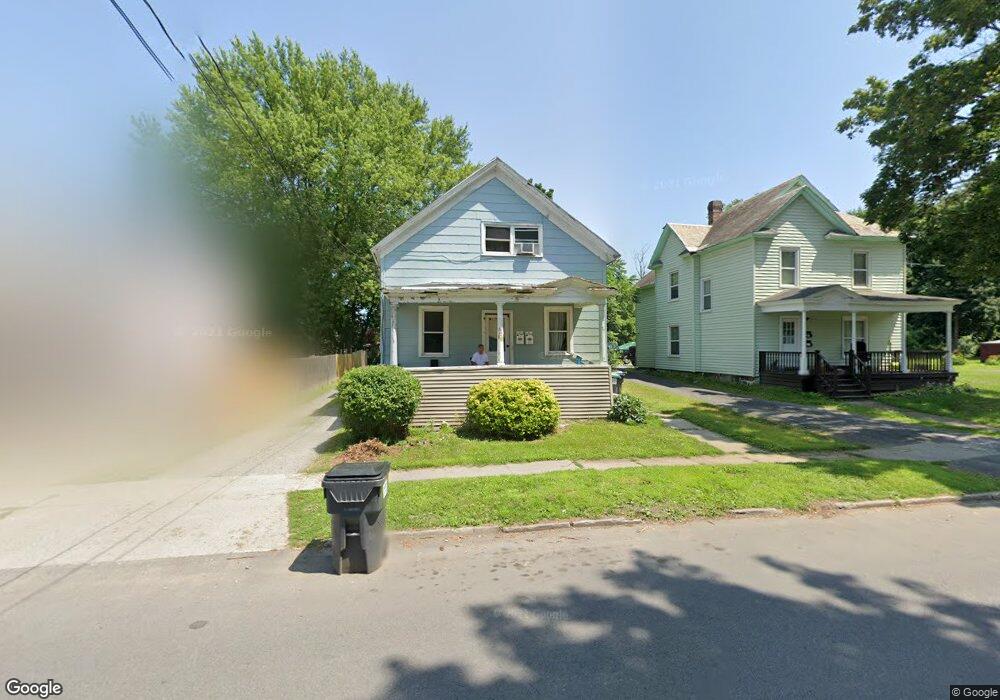
58 Haskell Ave Glens Falls, NY 12801
Estimated Value: $185,000 - $224,000
4
Beds
2
Baths
1,700
Sq Ft
$120/Sq Ft
Est. Value
About This Home
This home is located at 58 Haskell Ave, Glens Falls, NY 12801 and is currently estimated at $204,000, approximately $120 per square foot. 58 Haskell Ave is a home located in Warren County with nearby schools including Abraham Wing School, St. Mary-St. Alphonsus Catholic School, and Greater Glens Falls Christian Academy.
Ownership History
Date
Name
Owned For
Owner Type
Purchase Details
Closed on
Apr 9, 2018
Sold by
Sankey Peter M and Porzio Jessica E
Bought by
Sankeyland Llc
Current Estimated Value
Home Financials for this Owner
Home Financials are based on the most recent Mortgage that was taken out on this home.
Original Mortgage
$436,000
Outstanding Balance
$375,127
Interest Rate
4.46%
Mortgage Type
Unknown
Estimated Equity
-$171,127
Purchase Details
Closed on
Oct 31, 2002
Sold by
Schiaroni Robert-Co Executor
Bought by
Payne Hal
Create a Home Valuation Report for This Property
The Home Valuation Report is an in-depth analysis detailing your home's value as well as a comparison with similar homes in the area
Home Values in the Area
Average Home Value in this Area
Purchase History
| Date | Buyer | Sale Price | Title Company |
|---|---|---|---|
| Sankeyland Llc | -- | -- | |
| Payne Hal | $44,500 | Daniel Mannix |
Source: Public Records
Mortgage History
| Date | Status | Borrower | Loan Amount |
|---|---|---|---|
| Open | Sankeyland Llc | $436,000 |
Source: Public Records
Tax History Compared to Growth
Tax History
| Year | Tax Paid | Tax Assessment Tax Assessment Total Assessment is a certain percentage of the fair market value that is determined by local assessors to be the total taxable value of land and additions on the property. | Land | Improvement |
|---|---|---|---|---|
| 2024 | $4,055 | $162,900 | $38,100 | $124,800 |
| 2023 | $3,777 | $148,100 | $38,100 | $110,000 |
| 2022 | $3,350 | $148,100 | $38,100 | $110,000 |
| 2021 | $2,893 | $74,300 | $13,900 | $60,400 |
| 2020 | $2,871 | $74,300 | $13,900 | $60,400 |
| 2019 | $1,371 | $74,300 | $13,900 | $60,400 |
| 2018 | $1,371 | $74,300 | $13,900 | $60,400 |
| 2017 | $1,345 | $74,300 | $13,900 | $60,400 |
| 2016 | $2,693 | $74,300 | $13,900 | $60,400 |
| 2015 | -- | $74,300 | $13,900 | $60,400 |
| 2014 | -- | $74,300 | $13,900 | $60,400 |
Source: Public Records
Map
Nearby Homes