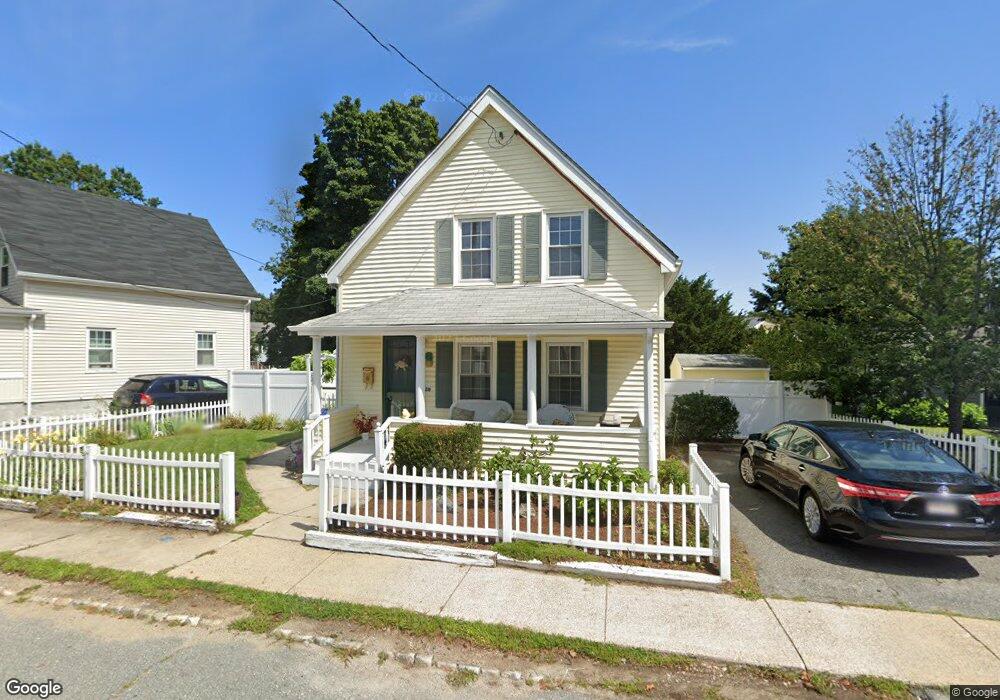
58 Hemingway St Winchester, MA 01890
North Main NeighborhoodEstimated Value: $838,000 - $1,014,000
3
Beds
2
Baths
1,392
Sq Ft
$669/Sq Ft
Est. Value
About This Home
This home is located at 58 Hemingway St, Winchester, MA 01890 and is currently estimated at $931,397, approximately $669 per square foot. 58 Hemingway St is a home located in Middlesex County with nearby schools including Lynch Elementary School, McCall Middle School, and Winchester High School.
Ownership History
Date
Name
Owned For
Owner Type
Purchase Details
Closed on
May 6, 2025
Sold by
Smith Emily L
Bought by
Emily L Smith 2025 Ft and Mcanena
Current Estimated Value
Purchase Details
Closed on
Oct 6, 1970
Bought by
Smith Richard O and Smith Emily L
Create a Home Valuation Report for This Property
The Home Valuation Report is an in-depth analysis detailing your home's value as well as a comparison with similar homes in the area
Home Values in the Area
Average Home Value in this Area
Purchase History
| Date | Buyer | Sale Price | Title Company |
|---|---|---|---|
| Emily L Smith 2025 Ft | -- | None Available | |
| Emily L Smith 2025 Ft | -- | None Available | |
| Smith Richard O | -- | -- |
Source: Public Records
Mortgage History
| Date | Status | Borrower | Loan Amount |
|---|---|---|---|
| Previous Owner | Smith Richard O | $210,000 | |
| Previous Owner | Smith Richard O | $45,000 | |
| Previous Owner | Smith Richard O | $20,000 |
Source: Public Records
Tax History
| Year | Tax Paid | Tax Assessment Tax Assessment Total Assessment is a certain percentage of the fair market value that is determined by local assessors to be the total taxable value of land and additions on the property. | Land | Improvement |
|---|---|---|---|---|
| 2025 | $9,407 | $848,200 | $548,800 | $299,400 |
| 2024 | $9,086 | $801,900 | $519,900 | $282,000 |
| 2023 | $9,088 | $770,200 | $476,600 | $293,600 |
| 2022 | $8,987 | $718,400 | $433,300 | $285,100 |
| 2021 | $8,383 | $653,400 | $368,300 | $285,100 |
| 2020 | $8,096 | $653,400 | $368,300 | $285,100 |
| 2019 | $7,038 | $581,200 | $296,100 | $285,100 |
| 2018 | $6,908 | $566,700 | $281,600 | $285,100 |
| 2017 | $6,467 | $526,600 | $267,200 | $259,400 |
| 2016 | $5,931 | $507,800 | $267,200 | $240,600 |
| 2015 | $5,858 | $482,500 | $241,900 | $240,600 |
| 2014 | $5,501 | $434,500 | $209,400 | $225,100 |
Source: Public Records
Map
Nearby Homes
- 149 Horn Pond Brook Rd
- 62 Richardson St
- 8 Russell Rd Unit 10
- 40 Pickering St
- 38 Pickering St Unit A
- 20 Arthur St
- 237 Swanton St
- 76 Woodside Rd
- 2 Maria Ct
- 200 Swanton St Unit 228
- 200 Swanton St Unit T28
- 53 Lake St
- 171 Swanton St Unit 73
- 6 Ivy Cir
- 9 Charles Rd
- 20 Charles Rd
- 666 Main St Unit 315
- 10 Dartmouth St
- 4 Dartmouth St
- 15 Wildwood St
- 54 Hemingway St
- 68 Hemingway St Unit 70
- 70 Hemingway St Unit 70
- 36 Hemingway St
- 89 Hemingway St
- 59 Hemingway St Unit 61
- 59 Hemingway St Unit 59
- 59 Hemingway St Unit 2
- 42 Hemingway St
- 55 Hemingway St Unit 57
- 65 Hemingway St
- 32 Hemingway St
- 74 Hemingway St
- 28 Hemingway St
- 2 Upland Rd
- 76 Hemingway St Unit 78
- 78 Hemingway St
- 76 Hemingway St Unit 2
- 45 Hemingway St
- 41 Hemingway St
Your Personal Tour Guide
Ask me questions while you tour the home.