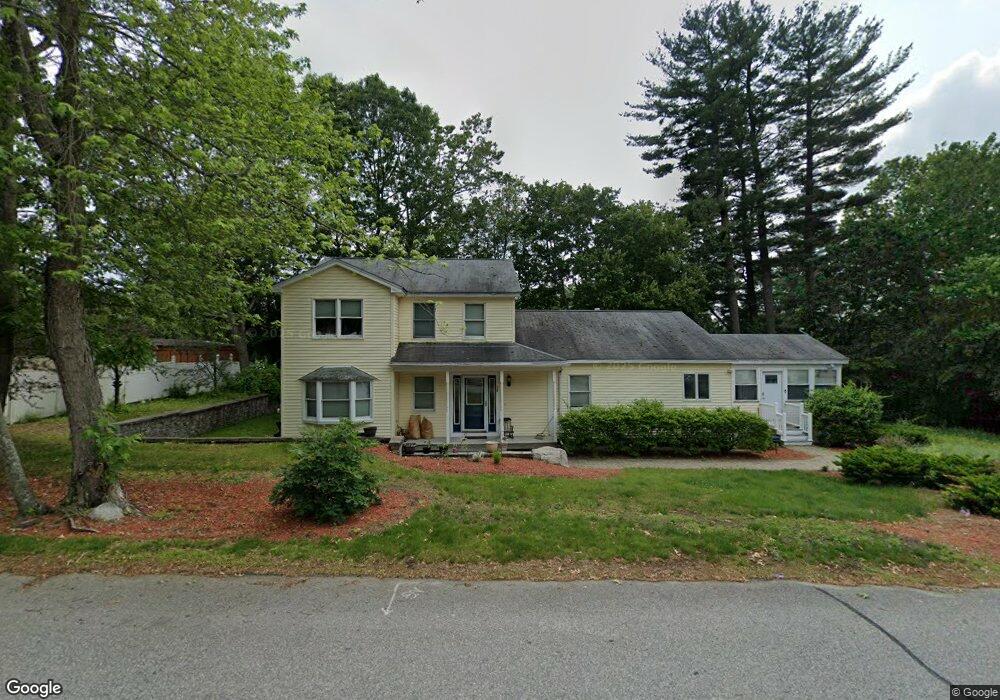
58 Hilltop Rd Unit SF Dracut, MA 01826
Estimated Value: $628,000 - $696,000
4
Beds
2
Baths
2,400
Sq Ft
$277/Sq Ft
Est. Value
About This Home
This home is located at 58 Hilltop Rd Unit SF, Dracut, MA 01826 and is currently estimated at $663,615, approximately $276 per square foot. 58 Hilltop Rd Unit SF is a home located in Middlesex County with nearby schools including Brookside Elementary School, Richardson Middle School, and Dracut Senior High School.
Ownership History
Date
Name
Owned For
Owner Type
Purchase Details
Closed on
Jul 28, 2017
Sold by
Roy Donna
Bought by
Bonilla Edwin and Gaitan Nora
Current Estimated Value
Home Financials for this Owner
Home Financials are based on the most recent Mortgage that was taken out on this home.
Original Mortgage
$225,000
Outstanding Balance
$187,491
Interest Rate
3.91%
Mortgage Type
New Conventional
Estimated Equity
$476,124
Purchase Details
Closed on
Jan 30, 1998
Sold by
Roper Rita M
Bought by
Roy Donna P
Purchase Details
Closed on
Jul 11, 1997
Sold by
Sousa Colleen M
Bought by
Royal Realty Nt
Purchase Details
Closed on
Apr 26, 1991
Sold by
Burke Laurence
Bought by
Wilson Colleen M
Create a Home Valuation Report for This Property
The Home Valuation Report is an in-depth analysis detailing your home's value as well as a comparison with similar homes in the area
Home Values in the Area
Average Home Value in this Area
Purchase History
| Date | Buyer | Sale Price | Title Company |
|---|---|---|---|
| Bonilla Edwin | $375,000 | -- | |
| Roy Donna P | $82,000 | -- | |
| Royal Realty Nt | $57,500 | -- | |
| Roper Rita M | $30,000 | -- | |
| Wilson Colleen M | $84,000 | -- |
Source: Public Records
Mortgage History
| Date | Status | Borrower | Loan Amount |
|---|---|---|---|
| Open | Bonilla Edwin | $225,000 | |
| Previous Owner | Wilson Colleen M | $290,000 | |
| Previous Owner | Wilson Colleen M | $144,000 |
Source: Public Records
Tax History Compared to Growth
Tax History
| Year | Tax Paid | Tax Assessment Tax Assessment Total Assessment is a certain percentage of the fair market value that is determined by local assessors to be the total taxable value of land and additions on the property. | Land | Improvement |
|---|---|---|---|---|
| 2025 | $5,401 | $533,700 | $199,200 | $334,500 |
| 2024 | $5,212 | $498,800 | $189,700 | $309,100 |
| 2023 | $5,051 | $436,200 | $165,000 | $271,200 |
| 2022 | $4,953 | $403,000 | $149,900 | $253,100 |
| 2021 | $4,781 | $367,500 | $136,300 | $231,200 |
| 2020 | $4,628 | $346,700 | $132,300 | $214,400 |
| 2019 | $4,426 | $321,900 | $125,900 | $196,000 |
| 2018 | $9,980 | $313,400 | $125,900 | $187,500 |
| 2017 | $4,399 | $313,400 | $125,900 | $187,500 |
| 2016 | $4,281 | $288,500 | $121,100 | $167,400 |
| 2015 | $4,131 | $276,700 | $121,100 | $155,600 |
| 2014 | $3,863 | $266,600 | $121,100 | $145,500 |
Source: Public Records
Map
Nearby Homes
- 14 D St
- 97 Passaconaway Dr
- 79 B St
- 671 Nashua Rd
- 10 Edwards St
- 17 Spare St
- 53 4th St
- 67 2nd St
- 135 Stewart St Unit 1
- 32 Walnut St
- 29 Mill St Unit B
- 1905 Lakeview Ave
- 19 Mcgrath Rd
- 17 Summer St
- 25 Settlers Way
- 124 Tennis Plaza Rd Unit 22
- 46 Long Pond Rd
- 73 A&B Mammoth Rd
- 73 Mammoth Rd Unit A&B
- 73 Mammoth Rd