Estimated Value: $381,000 - $444,000
4
Beds
3
Baths
2,749
Sq Ft
$147/Sq Ft
Est. Value
About This Home
This home is located at 58 Horseshoe Trail, Hiram, GA 30141 and is currently estimated at $404,064, approximately $146 per square foot. 58 Horseshoe Trail is a home located in Paulding County with nearby schools including Hiram Elementary School, P. B. Ritch Middle School, and East Paulding High School.
Ownership History
Date
Name
Owned For
Owner Type
Purchase Details
Closed on
Nov 1, 2017
Sold by
Oakleigh Pointe Llc
Bought by
Paran Homes Llc
Current Estimated Value
Purchase Details
Closed on
Mar 17, 2010
Sold by
Citimortgage Series 2007-6
Bought by
Black Tomika
Home Financials for this Owner
Home Financials are based on the most recent Mortgage that was taken out on this home.
Original Mortgage
$142,900
Interest Rate
5.01%
Mortgage Type
New Conventional
Purchase Details
Closed on
Dec 1, 2009
Sold by
Robinson Patrick M
Bought by
Citigroup Mtg Series 2007-6
Create a Home Valuation Report for This Property
The Home Valuation Report is an in-depth analysis detailing your home's value as well as a comparison with similar homes in the area
Home Values in the Area
Average Home Value in this Area
Purchase History
| Date | Buyer | Sale Price | Title Company |
|---|---|---|---|
| Paran Homes Llc | $816,000 | -- | |
| Black Tomika | $142,900 | -- | |
| Citigroup Mtg Series 2007-6 | $178,400 | -- |
Source: Public Records
Mortgage History
| Date | Status | Borrower | Loan Amount |
|---|---|---|---|
| Previous Owner | Black Tomika | $142,900 |
Source: Public Records
Tax History Compared to Growth
Tax History
| Year | Tax Paid | Tax Assessment Tax Assessment Total Assessment is a certain percentage of the fair market value that is determined by local assessors to be the total taxable value of land and additions on the property. | Land | Improvement |
|---|---|---|---|---|
| 2024 | $3,501 | $143,972 | $16,000 | $127,972 |
| 2023 | $3,721 | $145,240 | $16,000 | $129,240 |
| 2022 | $3,313 | $128,964 | $12,000 | $116,964 |
| 2021 | $2,845 | $99,768 | $12,000 | $87,768 |
| 2020 | $2,652 | $91,136 | $12,000 | $79,136 |
| 2019 | $2,450 | $83,176 | $12,000 | $71,176 |
| 2018 | $2,181 | $74,244 | $12,000 | $62,244 |
| 2017 | $2,114 | $71,072 | $12,000 | $59,072 |
| 2016 | $2,004 | $68,136 | $12,000 | $56,136 |
| 2015 | $2,014 | $67,280 | $12,000 | $55,280 |
| 2014 | $1,649 | $54,084 | $12,000 | $42,084 |
| 2013 | -- | $50,520 | $12,000 | $38,520 |
Source: Public Records
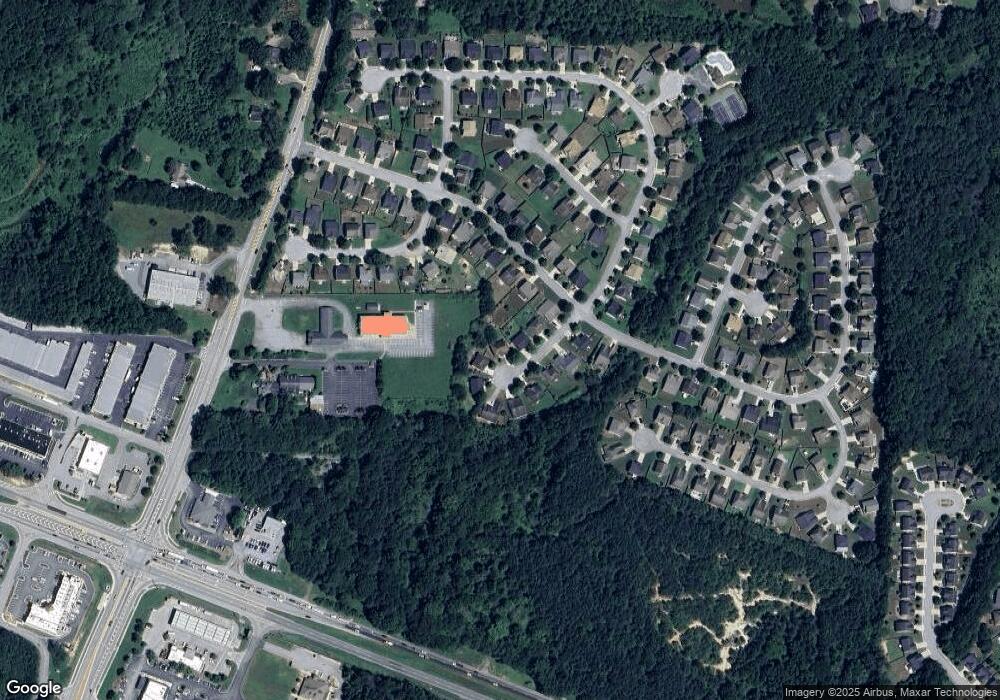
Map
Nearby Homes
- 1261 Silvercrest Ct SW
- 1520 Silver Mist Cir
- 1502 Silver Mist Cir
- 1236 Silvercrest Ct SW
- 5809 Warren Farm Rd SW
- 5809 Warren Farm Rd
- 1116 Silverbrooke Dr
- 5555 Elliott Rd
- 5638 Berney Cir
- 3225 Warren Creek Dr
- 5727 Tillman Way
- 5620 Tillman Way
- 5691 Tillman Way
- 965 Angham Rd
- 5699 Tillman Way
- 5683 Tillman Way
- 5707 Tillman Way
- 5651 Tillman Way
- 1625 Lake Rd
- 6053 Hiram Industrial Dr
- 50 Horseshoe Ln
- 42 Horseshoe Trail
- 64 Horseshoe Trail Unit 112
- 64 Horseshoe Trail
- 70 Horseshoe Trail
- 28 Horseshoe Trail
- 180 Poplar Farms Dr
- 53 Horseshoe Trail
- 12 Horseshoe Trail
- 166 Poplar Farms Dr
- 39 Horseshoe Trail
- 61 Horseshoe Trail
- 25 Horseshoe Trail
- 154 Poplar Farms Dr
- 67 Horseshoe Trail
- 11 Horseshoe Trail
- 35 Stallion Way
- 35 Stallion Way
- 140 Poplar Farms Dr
- 199 Poplar Farms Dr