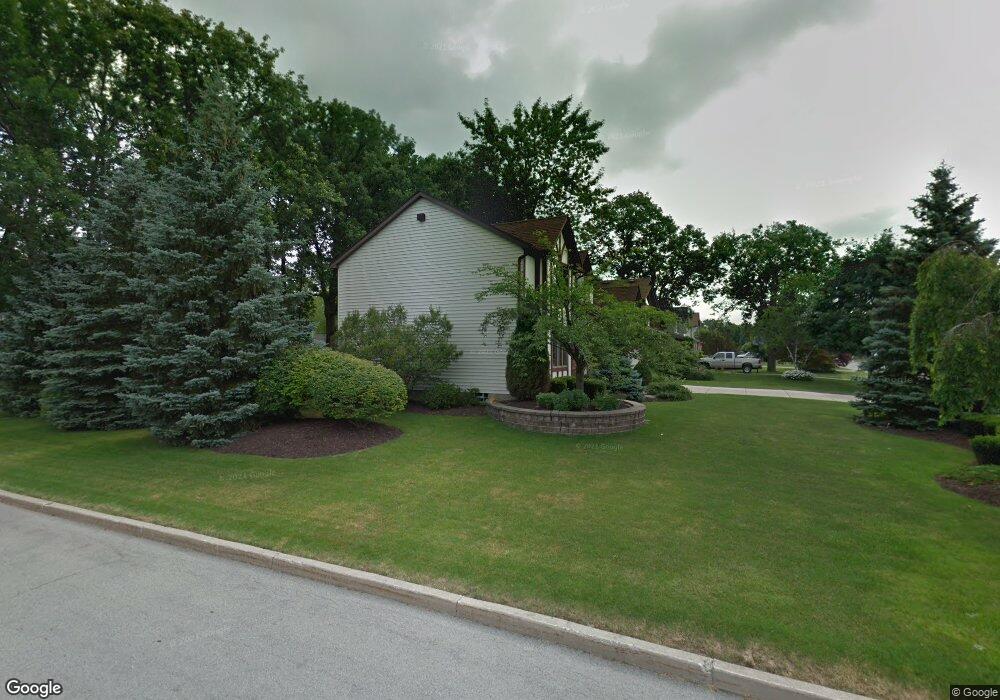
58 Independence Dr Lockport, NY 14094
Estimated Value: $286,000 - $369,000
4
Beds
3
Baths
2,437
Sq Ft
$142/Sq Ft
Est. Value
About This Home
This home is located at 58 Independence Dr, Lockport, NY 14094 and is currently estimated at $346,486, approximately $142 per square foot. 58 Independence Dr is a home located in Niagara County with nearby schools including Aaron Mossell Junior High School, Lockport High School, and DeSales Catholic School.
Ownership History
Date
Name
Owned For
Owner Type
Purchase Details
Closed on
Sep 4, 2020
Sold by
Alexander Deverett A
Bought by
Agronin Roth Colleen
Current Estimated Value
Purchase Details
Closed on
Jul 22, 2019
Sold by
Agronin William L and Agronin Nancy A
Bought by
Agronin Roth Colleen M and Agronin Family Trust
Purchase Details
Closed on
Jul 15, 2018
Sold by
Arnold Christopher C
Bought by
Roth Brian P and Roth Colleen M
Home Financials for this Owner
Home Financials are based on the most recent Mortgage that was taken out on this home.
Original Mortgage
$189,000
Interest Rate
4.5%
Mortgage Type
New Conventional
Purchase Details
Closed on
Jul 6, 2007
Sold by
Thiel Melissa
Bought by
Arnold Christopher
Home Financials for this Owner
Home Financials are based on the most recent Mortgage that was taken out on this home.
Original Mortgage
$150,575
Interest Rate
6.54%
Mortgage Type
Unknown
Purchase Details
Closed on
Sep 25, 2002
Sold by
Preston Tarrell A Susan S
Bought by
Thiel Melissa J
Create a Home Valuation Report for This Property
The Home Valuation Report is an in-depth analysis detailing your home's value as well as a comparison with similar homes in the area
Home Values in the Area
Average Home Value in this Area
Purchase History
| Date | Buyer | Sale Price | Title Company |
|---|---|---|---|
| Agronin Roth Colleen | $153,500 | None Available | |
| Agronin Roth Colleen M | -- | None Available | |
| Roth Brian P | $210,000 | None Available | |
| Arnold Christopher | $158,500 | Justine Welch | |
| Thiel Melissa J | $157,500 | Justin White |
Source: Public Records
Mortgage History
| Date | Status | Borrower | Loan Amount |
|---|---|---|---|
| Previous Owner | Roth Brian P | $189,000 | |
| Previous Owner | Arnold Christopher | $150,575 |
Source: Public Records
Tax History Compared to Growth
Tax History
| Year | Tax Paid | Tax Assessment Tax Assessment Total Assessment is a certain percentage of the fair market value that is determined by local assessors to be the total taxable value of land and additions on the property. | Land | Improvement |
|---|---|---|---|---|
| 2024 | $7,393 | $272,000 | $21,600 | $250,400 |
| 2023 | $7,465 | $267,000 | $21,600 | $245,400 |
| 2022 | $6,082 | $245,000 | $21,600 | $223,400 |
| 2021 | $6,617 | $167,800 | $23,900 | $143,900 |
| 2020 | $6,475 | $167,800 | $23,900 | $143,900 |
| 2019 | $1,451 | $167,800 | $23,900 | $143,900 |
| 2018 | $3,964 | $167,800 | $23,900 | $143,900 |
| 2017 | $3,926 | $167,800 | $23,900 | $143,900 |
| 2016 | $3,751 | $167,800 | $23,900 | $143,900 |
| 2015 | -- | $167,800 | $23,900 | $143,900 |
| 2014 | -- | $167,800 | $23,900 | $143,900 |
Source: Public Records
Map
Nearby Homes
- 27 Independence Dr
- 105 Obrien Dr
- 151 Independence Dr
- 206 Continental Dr
- 178 Continental Dr
- 40 Georgia Ave
- 76 Elizabeth Dr
- 869 Lincoln Ave
- 5451 Carleton Lake Dr
- 20 Park Lane Cir
- 6773 Akron Rd
- 6801A Mulberry Ln Unit B
- 6685 Curtis Ct
- 546 High St
- 89 Park Lane Cir
- 105 Park Lane Cir
- 144 Grant St
- 120 Park Lane Cir
- Patio A Plan at Lockhaven Estates
- Patio B Plan at Lockhaven Estates
- 50 Independence Dr
- 88 Independence Dr
- 44 Independence Dr
- 96 Independence Dr
- 65 Independence Dr
- 63 Independence Dr
- 71 Independence Dr
- 55 Independence Dr
- 49 Independence Dr
- 40 Independence Dr
- 59 Independence Dr
- 75 Independence Dr
- 61 Independence Dr
- 106 Independence Dr
- 45 Independence Dr
- 34 Independence Dr
- 33 Lindhurst Dr
- 27 Lindhurst Dr
- 112 Independence Dr