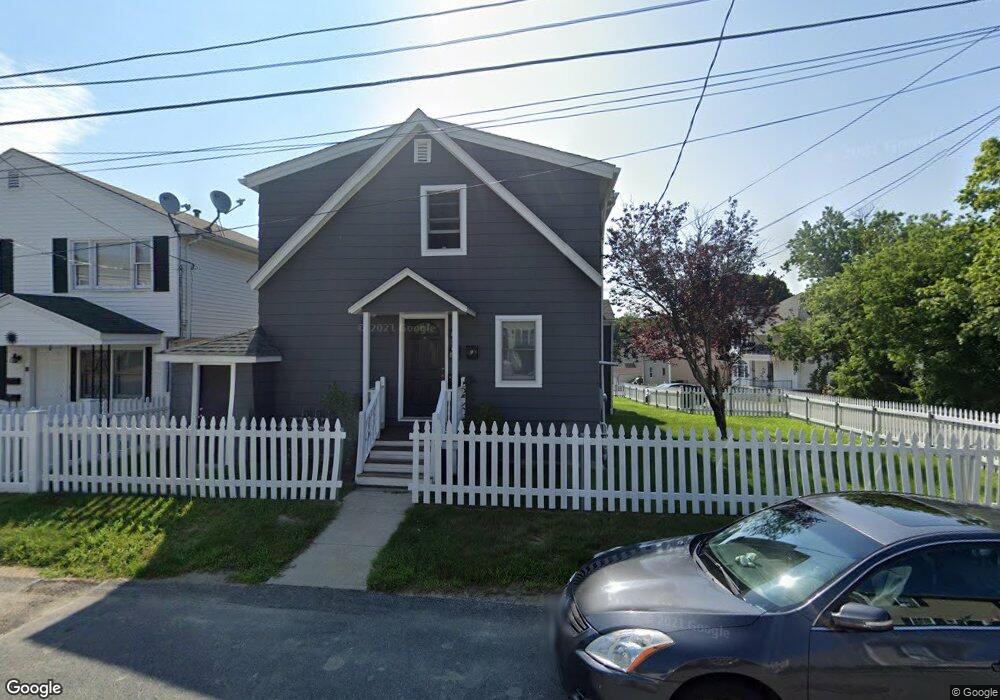
58 Keene St Fall River, MA 02723
Flint NeighborhoodEstimated Value: $620,000 - $835,000
5
Beds
3
Baths
3,472
Sq Ft
$199/Sq Ft
Est. Value
About This Home
This home is located at 58 Keene St, Fall River, MA 02723 and is currently estimated at $689,395, approximately $198 per square foot. 58 Keene St is a home located in Bristol County with nearby schools including Samuel Watson, Talbot Innovation School, and B M C Durfee High School.
Ownership History
Date
Name
Owned For
Owner Type
Purchase Details
Closed on
Apr 5, 1990
Sold by
Fall River Rlty Inc
Bought by
Gendreau Dennis
Current Estimated Value
Home Financials for this Owner
Home Financials are based on the most recent Mortgage that was taken out on this home.
Original Mortgage
$128,000
Interest Rate
10.22%
Mortgage Type
Purchase Money Mortgage
Purchase Details
Closed on
Nov 22, 1989
Sold by
Fall River Constr
Bought by
Fall River Realty Inc
Create a Home Valuation Report for This Property
The Home Valuation Report is an in-depth analysis detailing your home's value as well as a comparison with similar homes in the area
Home Values in the Area
Average Home Value in this Area
Purchase History
| Date | Buyer | Sale Price | Title Company |
|---|---|---|---|
| Gendreau Dennis | $160,000 | -- | |
| Fall River Realty Inc | $140,000 | -- |
Source: Public Records
Mortgage History
| Date | Status | Borrower | Loan Amount |
|---|---|---|---|
| Open | Fall River Realty Inc | $127,500 | |
| Closed | Fall River Realty Inc | $12,000 | |
| Closed | Fall River Realty Inc | $133,179 | |
| Closed | Fall River Realty Inc | $128,000 |
Source: Public Records
Tax History
| Year | Tax Paid | Tax Assessment Tax Assessment Total Assessment is a certain percentage of the fair market value that is determined by local assessors to be the total taxable value of land and additions on the property. | Land | Improvement |
|---|---|---|---|---|
| 2025 | $4,807 | $419,800 | $114,800 | $305,000 |
| 2024 | $4,627 | $402,700 | $112,500 | $290,200 |
| 2023 | $4,169 | $339,800 | $101,400 | $238,400 |
| 2022 | $3,732 | $295,700 | $95,600 | $200,100 |
| 2021 | $3,469 | $250,800 | $91,400 | $159,400 |
| 2020 | $3,143 | $217,500 | $87,200 | $130,300 |
| 2019 | $2,842 | $194,900 | $91,100 | $103,800 |
| 2018 | $2,763 | $189,000 | $91,800 | $97,200 |
| 2017 | $2,646 | $189,000 | $91,800 | $97,200 |
| 2016 | $2,582 | $189,400 | $94,600 | $94,800 |
| 2015 | $2,477 | $189,400 | $94,600 | $94,800 |
| 2014 | $2,496 | $198,400 | $94,600 | $103,800 |
Source: Public Records
Map
Nearby Homes
- 34 Alsop St
- 116 Irving St
- 38 Eaton St
- 1792 Pleasant St Unit 1808
- 219 Earle St Unit 3
- 217 Earle St Unit 2
- 215 Earle St Unit 1
- 712 Eastern Ave
- 352 Barnes St
- 157 Earle St
- 3 Edgemond St
- 366 Alden St
- 144 Choate St
- 31 Choate St
- 756 County St
- 529 Eastern Ave
- 152 Alden St
- 580 County St
- 178 Thomas St
- 25 Lebanon St Unit D
Your Personal Tour Guide
Ask me questions while you tour the home.