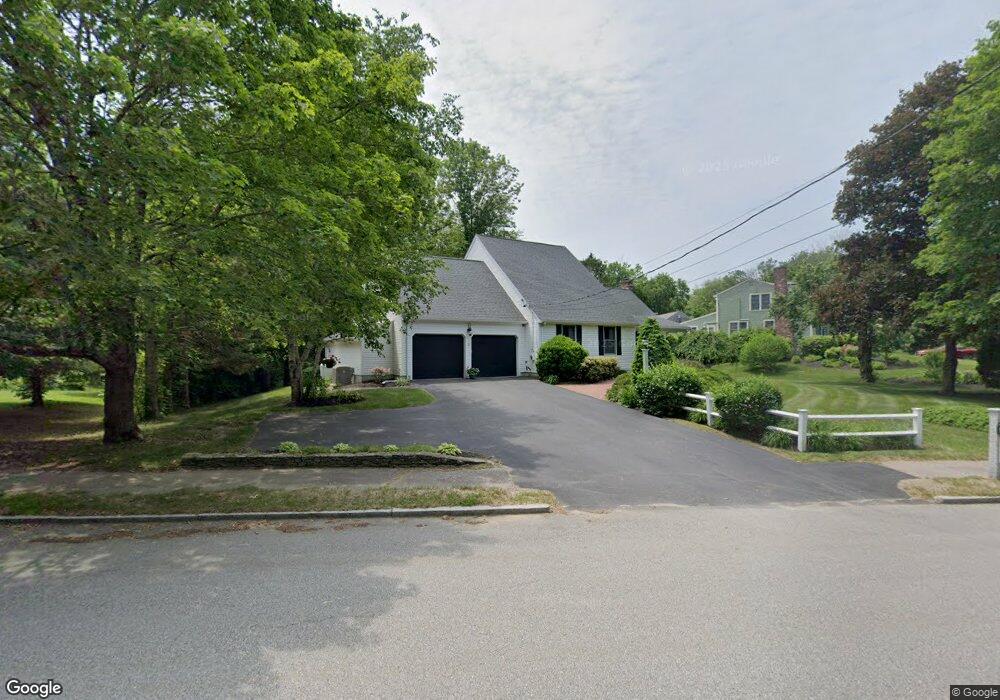
58 Kenneth St West Bridgewater, MA 02379
Estimated Value: $609,839 - $702,000
3
Beds
2
Baths
2,100
Sq Ft
$310/Sq Ft
Est. Value
About This Home
This home is located at 58 Kenneth St, West Bridgewater, MA 02379 and is currently estimated at $650,960, approximately $309 per square foot. 58 Kenneth St is a home located in Plymouth County with nearby schools including Spring Street Elementary School, Rose L. MacDonald Elementary School, and Howard Elementary School.
Ownership History
Date
Name
Owned For
Owner Type
Purchase Details
Closed on
Aug 8, 2011
Sold by
Boyd Ret and Boyd Francis J
Bought by
Boyd Irt and Mccafferty Kristin F
Current Estimated Value
Purchase Details
Closed on
Aug 9, 2007
Sold by
Boyd Francis J and Boyd Mary L
Bought by
Boyd Tr Francis J and Boyd Mary L
Create a Home Valuation Report for This Property
The Home Valuation Report is an in-depth analysis detailing your home's value as well as a comparison with similar homes in the area
Home Values in the Area
Average Home Value in this Area
Purchase History
| Date | Buyer | Sale Price | Title Company |
|---|---|---|---|
| Boyd Irt | -- | -- | |
| Boyd Tr Francis J | -- | -- |
Source: Public Records
Mortgage History
| Date | Status | Borrower | Loan Amount |
|---|---|---|---|
| Previous Owner | Boyd Tr Francis J | $20,000 | |
| Previous Owner | Boyd Tr Francis J | $30,000 | |
| Previous Owner | Boyd Tr Francis J | $40,000 |
Source: Public Records
Tax History
| Year | Tax Paid | Tax Assessment Tax Assessment Total Assessment is a certain percentage of the fair market value that is determined by local assessors to be the total taxable value of land and additions on the property. | Land | Improvement |
|---|---|---|---|---|
| 2025 | $7,818 | $571,900 | $237,400 | $334,500 |
| 2024 | $7,459 | $526,400 | $216,500 | $309,900 |
| 2023 | $7,093 | $461,500 | $193,600 | $267,900 |
| 2022 | $6,697 | $412,900 | $185,300 | $227,600 |
| 2021 | $6,636 | $397,100 | $185,300 | $211,800 |
| 2020 | $6,448 | $393,900 | $185,300 | $208,600 |
| 2019 | $6,448 | $390,100 | $185,300 | $204,800 |
| 2018 | $3,339 | $368,100 | $166,600 | $201,500 |
| 2017 | $6,248 | $352,400 | $156,200 | $196,200 |
| 2016 | $6,156 | $342,000 | $145,800 | $196,200 |
| 2015 | $5,802 | $325,800 | $145,800 | $180,000 |
| 2014 | $5,305 | $321,700 | $145,800 | $175,900 |
Source: Public Records
Map
Nearby Homes
- Lot 1 Jeffrey Ln
- 22 Grant St
- Lots 1-4 Copeland St
- 19 Progressive Ave
- 616 N Elm St
- 93 Prospect St
- 10 Charles St
- 41 Victorian Way
- 16 Jason Way
- 12 Finny's Way
- 18 American Ave
- 16 Liberty St
- 31 Friendship Dr
- 92 Bryant St
- 326 Copeland St
- 9 Longworth Ave Unit 135
- 9 Longworth Ave Unit 132
- 35 Longworth Ave Unit 25
- 47 Southworth St
- 6 Andrea Way
Your Personal Tour Guide
Ask me questions while you tour the home.