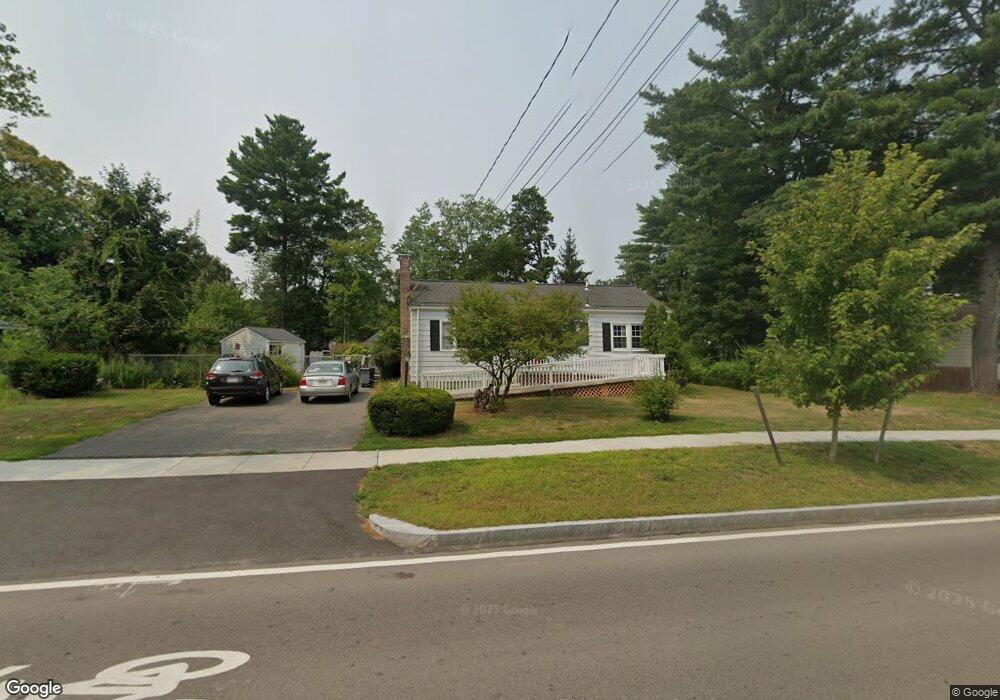
58 Main St Medway, MA 02053
Estimated Value: $518,940 - $583,000
3
Beds
1
Bath
909
Sq Ft
$602/Sq Ft
Est. Value
About This Home
This home is located at 58 Main St, Medway, MA 02053 and is currently estimated at $546,985, approximately $601 per square foot. 58 Main St is a home located in Norfolk County with nearby schools including John D. McGovern Elementary School, Burke-Memorial Elementary, and Medway Middle School.
Ownership History
Date
Name
Owned For
Owner Type
Purchase Details
Closed on
Aug 18, 2017
Sold by
Tenney William F and Tenney Dorothy A
Bought by
Tenney Ft
Current Estimated Value
Purchase Details
Closed on
Aug 14, 2017
Sold by
Tenney William F and Tenney Dorothy A
Bought by
Tenney William F and Tenney Dorothy A
Purchase Details
Closed on
Apr 16, 2013
Sold by
Tenney William F and Tenney Dorothy A
Bought by
Tenney William F and Tenney Dorothy A
Home Financials for this Owner
Home Financials are based on the most recent Mortgage that was taken out on this home.
Original Mortgage
$107,000
Interest Rate
3.55%
Create a Home Valuation Report for This Property
The Home Valuation Report is an in-depth analysis detailing your home's value as well as a comparison with similar homes in the area
Home Values in the Area
Average Home Value in this Area
Purchase History
| Date | Buyer | Sale Price | Title Company |
|---|---|---|---|
| Tenney Ft | -- | -- | |
| Tenney William F | -- | -- | |
| Tenney William F | -- | -- |
Source: Public Records
Mortgage History
| Date | Status | Borrower | Loan Amount |
|---|---|---|---|
| Previous Owner | Tenney William F | $107,000 | |
| Previous Owner | Tenney William F | $58,000 |
Source: Public Records
Tax History
| Year | Tax Paid | Tax Assessment Tax Assessment Total Assessment is a certain percentage of the fair market value that is determined by local assessors to be the total taxable value of land and additions on the property. | Land | Improvement |
|---|---|---|---|---|
| 2025 | $5,868 | $411,800 | $254,400 | $157,400 |
| 2024 | $5,930 | $411,800 | $254,400 | $157,400 |
| 2023 | $5,652 | $354,600 | $222,100 | $132,500 |
| 2022 | $5,407 | $319,400 | $187,800 | $131,600 |
| 2021 | $5,048 | $289,100 | $169,600 | $119,500 |
| 2020 | $4,706 | $268,900 | $149,400 | $119,500 |
| 2019 | $4,322 | $254,700 | $141,300 | $113,400 |
| 2018 | $4,141 | $234,500 | $121,100 | $113,400 |
| 2017 | $4,105 | $229,100 | $121,100 | $108,000 |
| 2016 | $3,783 | $208,900 | $100,900 | $108,000 |
| 2015 | $3,810 | $208,900 | $100,900 | $108,000 |
| 2014 | $3,615 | $191,900 | $110,200 | $81,700 |
Source: Public Records
Map
Nearby Homes
- 50 Main St
- 33 Gorwin Dr
- 8 Gable Way
- 20 Broad St Unit 1
- 20 Broad St Unit 6
- 20 Broad St Unit A
- 20 Broad St Unit 4
- 25 Howe St
- 10 Barber St
- 14 Sanford St Unit 47
- 253 Village St
- 280 Village St Unit F1
- 40 Timber Crest Dr
- 176 Main St Unit 3
- 84 Winthrop St
- 32 Ohlson Cir
- 11 Fairway Ln
- 17 Fairway Ln
- 26 Timber Crest Dr
- 839 Lincoln St
Your Personal Tour Guide
Ask me questions while you tour the home.