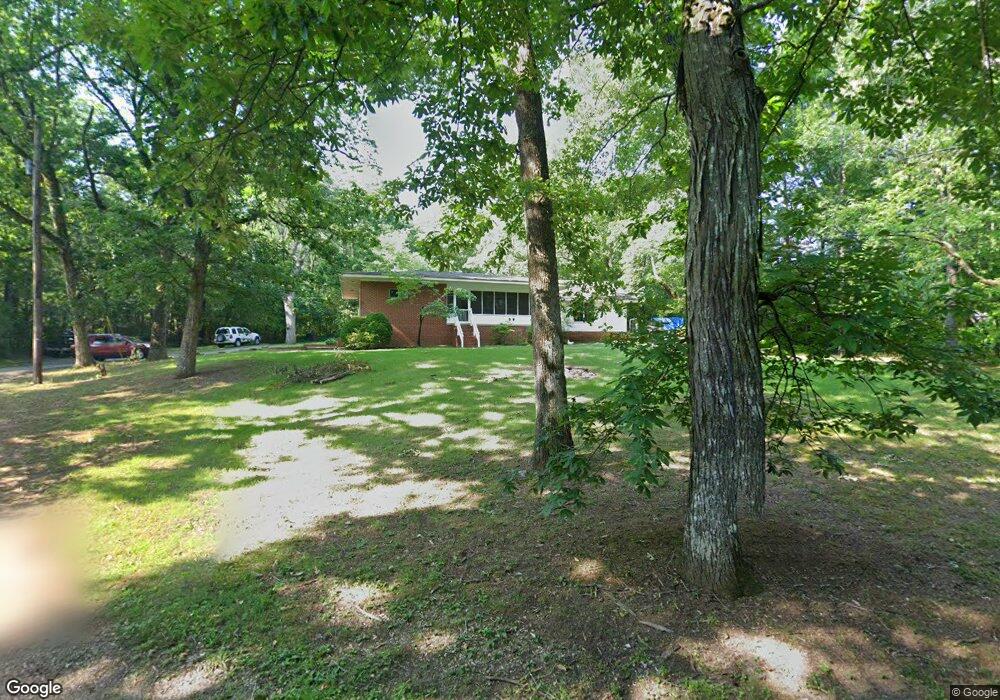
58 Martin Clement Rd Chickamauga, GA 30707
Pond Spring NeighborhoodEstimated Value: $253,000 - $518,000
--
Bed
1
Bath
1,955
Sq Ft
$174/Sq Ft
Est. Value
About This Home
This home is located at 58 Martin Clement Rd, Chickamauga, GA 30707 and is currently estimated at $339,890, approximately $173 per square foot. 58 Martin Clement Rd is a home located in Walker County with nearby schools including Lafayette High School and Oakwood Christian Academy.
Ownership History
Date
Name
Owned For
Owner Type
Purchase Details
Closed on
Mar 14, 2024
Sold by
Camp Macie
Bought by
Mussared Christian
Current Estimated Value
Purchase Details
Closed on
Mar 30, 2023
Sold by
Jones Terry Henderson Executor
Bought by
Mussared Christian Troy and Camp Macie
Home Financials for this Owner
Home Financials are based on the most recent Mortgage that was taken out on this home.
Original Mortgage
$212,121
Interest Rate
6.65%
Mortgage Type
New Conventional
Purchase Details
Closed on
Nov 15, 2017
Sold by
Clements Mary Louise
Bought by
Jones Wesley Vance
Purchase Details
Closed on
Jul 3, 1985
Sold by
Clements George W
Bought by
Clements Louise
Purchase Details
Closed on
Jan 1, 1972
Bought by
Clements George W
Create a Home Valuation Report for This Property
The Home Valuation Report is an in-depth analysis detailing your home's value as well as a comparison with similar homes in the area
Home Values in the Area
Average Home Value in this Area
Purchase History
| Date | Buyer | Sale Price | Title Company |
|---|---|---|---|
| Mussared Christian | -- | -- | |
| Mussared Christian Troy | $210,000 | -- | |
| Jones Wesley Vance | -- | -- | |
| Clements Louise | -- | -- | |
| Clements George W | -- | -- |
Source: Public Records
Mortgage History
| Date | Status | Borrower | Loan Amount |
|---|---|---|---|
| Previous Owner | Mussared Christian Troy | $212,121 |
Source: Public Records
Tax History Compared to Growth
Tax History
| Year | Tax Paid | Tax Assessment Tax Assessment Total Assessment is a certain percentage of the fair market value that is determined by local assessors to be the total taxable value of land and additions on the property. | Land | Improvement |
|---|---|---|---|---|
| 2024 | $1,980 | $109,319 | $25,462 | $83,857 |
| 2023 | $274 | $102,092 | $22,734 | $79,358 |
| 2022 | $196 | $79,343 | $11,293 | $68,050 |
| 2021 | $196 | $65,846 | $11,293 | $54,553 |
| 2020 | $196 | $54,269 | $11,293 | $42,976 |
| 2019 | $196 | $54,269 | $11,293 | $42,976 |
| 2018 | $1,436 | $54,269 | $11,293 | $42,976 |
| 2017 | $1,890 | $72,721 | $22,249 | $50,472 |
| 2016 | $220 | $72,721 | $22,249 | $50,472 |
| 2015 | $187 | $39,255 | $13,320 | $25,935 |
| 2014 | $120 | $39,255 | $13,320 | $25,935 |
| 2013 | $1,924 | $39,255 | $13,320 | $25,935 |
Source: Public Records
Map
Nearby Homes
- 146 Fescue Dr
- 15 Fescue Dr
- 77 Garretts Chapel Rd
- 694 Meadow Dr
- 106 McClatchy Alley
- 1527 Glass Mill Rd
- 103 Dogwood Trail
- 406 E 16th St
- 508 E 14th St
- 309 E 16th St
- 201 E Tennant Cir
- 997 W West 12th St
- 997 W 12th St
- 16 Euclid Ave
- 876 Childress Hollow Rd
- 400 Gordon St
- 17 W Fork Ln
- 111 Clebourne Ave
- 301 Clebourne Ave
- 107 Wilder Ave
- 1833 Georgia 341
- 1833 S Highway 341
- 81 Martin Clement Rd
- 1822 S Highway 341
- 1822 S Highway 341
- 1859 Georgia 341
- 1848 S Highway 341
- 1885 Georgia 341
- 1885 S Highway 341
- 1872 S Highway 341
- 1902 Georgia 341
- 182 Martin Clement Rd
- 1902 S 341 Hwy
- 1902 Highway S 341
- 1902 S Highway 341
- 151 Fescue Dr
- 109 Fescue Dr
- 1947 S Highway 341
- 83 Fescue Dr
- 1940 Georgia 341