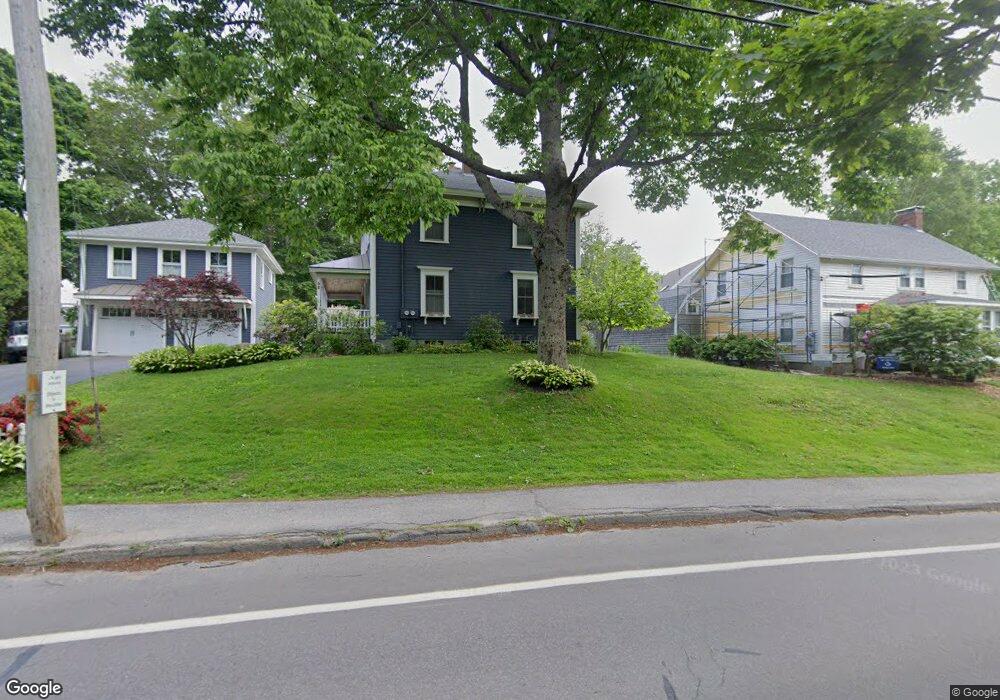
58 Mechanic St Camden, ME 04843
Estimated Value: $660,000 - $681,608
4
Beds
2
Baths
1,718
Sq Ft
$392/Sq Ft
Est. Value
About This Home
This home is located at 58 Mechanic St, Camden, ME 04843 and is currently estimated at $673,652, approximately $392 per square foot. 58 Mechanic St is a home located in Knox County with nearby schools including Camden-Rockport Elementary School, Camden-Rockport Middle School, and Camden Hills Regional High School.
Ownership History
Date
Name
Owned For
Owner Type
Purchase Details
Closed on
Nov 7, 2007
Sold by
Hage Susan M and Fordyce Dale R
Bought by
Hage Susan M
Current Estimated Value
Home Financials for this Owner
Home Financials are based on the most recent Mortgage that was taken out on this home.
Original Mortgage
$404,700
Interest Rate
6.47%
Mortgage Type
Purchase Money Mortgage
Create a Home Valuation Report for This Property
The Home Valuation Report is an in-depth analysis detailing your home's value as well as a comparison with similar homes in the area
Home Values in the Area
Average Home Value in this Area
Purchase History
| Date | Buyer | Sale Price | Title Company |
|---|---|---|---|
| Hage Susan M | -- | -- |
Source: Public Records
Mortgage History
| Date | Status | Borrower | Loan Amount |
|---|---|---|---|
| Closed | Hage Susan M | $404,700 |
Source: Public Records
Tax History Compared to Growth
Tax History
| Year | Tax Paid | Tax Assessment Tax Assessment Total Assessment is a certain percentage of the fair market value that is determined by local assessors to be the total taxable value of land and additions on the property. | Land | Improvement |
|---|---|---|---|---|
| 2024 | $6,500 | $619,000 | $230,100 | $388,900 |
| 2023 | $5,964 | $432,200 | $130,300 | $301,900 |
| 2022 | $5,705 | $432,200 | $130,300 | $301,900 |
| 2021 | $4,626 | $301,400 | $101,400 | $200,000 |
| 2020 | $4,530 | $301,400 | $101,400 | $200,000 |
| 2019 | $4,494 | $301,400 | $101,400 | $200,000 |
| 2018 | $5,254 | $353,100 | $115,300 | $237,800 |
| 2017 | $5,078 | $353,100 | $115,300 | $237,800 |
| 2016 | $4,370 | $280,300 | $53,300 | $227,000 |
| 2015 | $4,241 | $280,300 | $53,300 | $227,000 |
| 2014 | $3,837 | $265,900 | $53,300 | $212,600 |
| 2013 | $3,733 | $265,900 | $53,300 | $212,600 |
Source: Public Records
Map
Nearby Homes