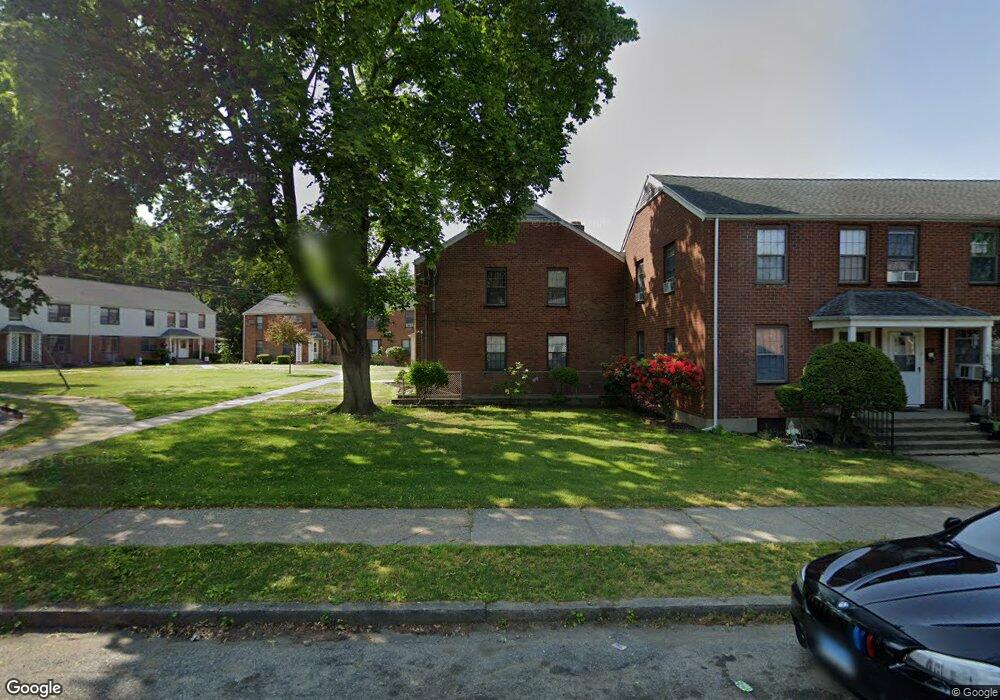
58 Mencel Cir Unit A Bridgeport, CT 06610
North Bridgeport NeighborhoodEstimated Value: $157,000 - $213,113
2
Beds
1
Bath
900
Sq Ft
$214/Sq Ft
Est. Value
About This Home
This home is located at 58 Mencel Cir Unit A, Bridgeport, CT 06610 and is currently estimated at $192,528, approximately $213 per square foot. 58 Mencel Cir Unit A is a home located in Fairfield County with nearby schools including Read School, Harding High School, and Achievement First Bridgeport Academy Elementary School.
Ownership History
Date
Name
Owned For
Owner Type
Purchase Details
Closed on
Feb 1, 2011
Sold by
Hall Sandra
Bought by
Corea-Gray Maria R
Current Estimated Value
Home Financials for this Owner
Home Financials are based on the most recent Mortgage that was taken out on this home.
Original Mortgage
$52,800
Outstanding Balance
$36,215
Interest Rate
4.83%
Estimated Equity
$156,313
Purchase Details
Closed on
Jun 5, 2007
Sold by
Jersey Brian and Jersey Tammy
Bought by
Hall Sandra
Home Financials for this Owner
Home Financials are based on the most recent Mortgage that was taken out on this home.
Original Mortgage
$135,375
Interest Rate
6.24%
Purchase Details
Closed on
Dec 1, 2003
Sold by
Lucien Investors Llc
Bought by
Jersey Brian and Jersey Tammy
Purchase Details
Closed on
Jun 12, 2002
Sold by
Chawla Surinderpal S
Bought by
Lucien Investors Llc
Create a Home Valuation Report for This Property
The Home Valuation Report is an in-depth analysis detailing your home's value as well as a comparison with similar homes in the area
Home Values in the Area
Average Home Value in this Area
Purchase History
| Date | Buyer | Sale Price | Title Company |
|---|---|---|---|
| Corea-Gray Maria R | $66,000 | -- | |
| Corea-Gray Maria R | $66,000 | -- | |
| Hall Sandra | $137,500 | -- | |
| Hall Sandra | $137,500 | -- | |
| Jersey Brian | $93,000 | -- | |
| Jersey Brian | $93,000 | -- | |
| Lucien Investors Llc | $59,976 | -- | |
| Lucien Investors Llc | $59,976 | -- |
Source: Public Records
Mortgage History
| Date | Status | Borrower | Loan Amount |
|---|---|---|---|
| Open | Lucien Investors Llc | $52,800 | |
| Closed | Lucien Investors Llc | $52,800 | |
| Previous Owner | Lucien Investors Llc | $135,375 |
Source: Public Records
Tax History
| Year | Tax Paid | Tax Assessment Tax Assessment Total Assessment is a certain percentage of the fair market value that is determined by local assessors to be the total taxable value of land and additions on the property. | Land | Improvement |
|---|---|---|---|---|
| 2025 | $2,189 | $50,380 | $0 | $50,380 |
| 2024 | $2,189 | $50,380 | $0 | $50,380 |
| 2023 | $2,189 | $50,380 | $0 | $50,380 |
| 2022 | $2,189 | $50,380 | $0 | $50,380 |
| 2021 | $2,189 | $50,380 | $0 | $50,380 |
| 2020 | $1,995 | $36,950 | $0 | $36,950 |
| 2019 | $1,995 | $36,950 | $0 | $36,950 |
| 2018 | $2,009 | $36,950 | $0 | $36,950 |
| 2017 | $2,009 | $36,950 | $0 | $36,950 |
| 2016 | $2,009 | $36,950 | $0 | $36,950 |
| 2015 | $3,004 | $71,190 | $0 | $71,190 |
| 2014 | $3,004 | $71,190 | $0 | $71,190 |
Source: Public Records
Map
Nearby Homes
- 11 Nob Hill Cir
- 211 Louisiana Ave Unit D
- 186 Louisiana Ave Unit D
- 261 Pennsylvania Ave
- 132 Virginia Ave Unit 132
- 170 Huntington Turnpike
- 120 Huntington Turnpike Unit 202
- 33 Louisiana Ave Unit 35
- 119 Jennings Ave
- 2100-2102 E Main St
- 2092-2096 E Main St
- 46 York St
- 2034 E Main St
- 2031 E Main St
- 142 Palm St
- 100-102 Ashley St
- 156 Dayton Rd
- 285 Hillcrest Rd
- 250 Dayton Rd
- 74 Hollywood Ave
- 58 Mencel Cir Unit C
- 58 Mencel Cir Unit D
- 58 Mencel Cir Unit B
- 58 Mencel Cir Unit A211
- 46 Mencel Cir
- 54 Mencel Cir
- 56 Mencel Cir
- 50 Mencel Cir Unit C
- 50 Mencel Cir Unit D
- 50 Mencel Cir Unit B
- 40 Mencel Cir
- 40 Mencel Cir Unit 199
- 40 Mencel Cir Unit 40
- 66 Mencel Cir
- 68 Mencel Cir
- 20 Mencel Cir
- 74 Mencel Cir Unit C
- 74 Mencel Cir Unit A
- 74 Mencel Cir Unit D
- 74 Mencel Cir Unit B
Your Personal Tour Guide
Ask me questions while you tour the home.