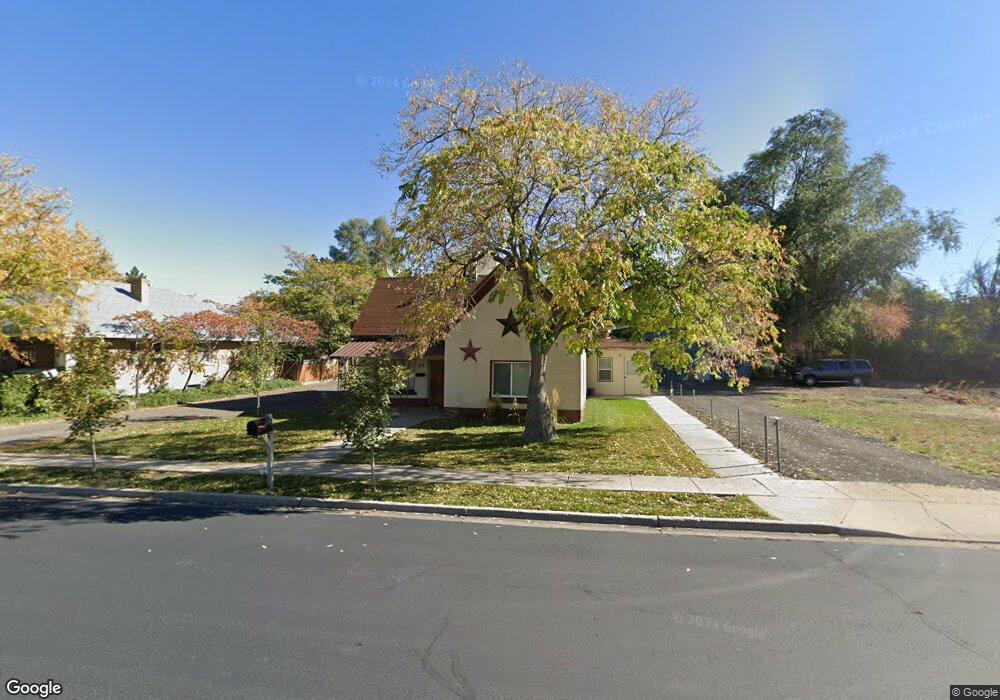
58 N 200 E Spanish Fork, UT 84660
Estimated Value: $627,000
2
Beds
2
Baths
1,329
Sq Ft
$472/Sq Ft
Est. Value
About This Home
This home is located at 58 N 200 E, Spanish Fork, UT 84660 and is currently estimated at $627,000, approximately $471 per square foot. 58 N 200 E is a home located in Utah County with nearby schools including Park Elementary School, Diamond Fork Junior High School, and Spanish Fork Jr High School.
Ownership History
Date
Name
Owned For
Owner Type
Purchase Details
Closed on
Jul 7, 2021
Sold by
Leifson Ruth N
Bought by
Ruth N Leifson Trust
Current Estimated Value
Home Financials for this Owner
Home Financials are based on the most recent Mortgage that was taken out on this home.
Original Mortgage
$243,750
Outstanding Balance
$226,370
Interest Rate
2.9%
Mortgage Type
New Conventional
Purchase Details
Closed on
Jul 2, 2021
Sold by
Ruth N Leifson Trust
Bought by
Giles Rocky and Giles Judd Leifson
Home Financials for this Owner
Home Financials are based on the most recent Mortgage that was taken out on this home.
Original Mortgage
$243,750
Outstanding Balance
$226,370
Interest Rate
2.9%
Mortgage Type
New Conventional
Purchase Details
Closed on
Dec 27, 2008
Sold by
Leifson Ruth N
Bought by
Leifson Ruth Nelson and Ruth Nelson Leifson Family Tru
Purchase Details
Closed on
Oct 14, 2003
Sold by
Leifson Ruth N and Ruth N Leifson Trust
Bought by
Leifson Ruth N and Ruth N Leifson Trust
Create a Home Valuation Report for This Property
The Home Valuation Report is an in-depth analysis detailing your home's value as well as a comparison with similar homes in the area
Home Values in the Area
Average Home Value in this Area
Purchase History
Date | Buyer | Sale Price | Title Company |
---|---|---|---|
Ruth N Leifson Trust | -- | -- | |
Giles Rocky | -- | Cottonwood Title Ins Agcy In | |
Leifson Ruth Nelson | -- | None Available | |
Leifson Ruth N | -- | Affiliated First Title |
Source: Public Records
Mortgage History
Date | Status | Borrower | Loan Amount |
---|---|---|---|
Open | Giles Rocky | $243,750 |
Source: Public Records
Tax History Compared to Growth
Tax History
Year | Tax Paid | Tax Assessment Tax Assessment Total Assessment is a certain percentage of the fair market value that is determined by local assessors to be the total taxable value of land and additions on the property. | Land | Improvement |
---|---|---|---|---|
2024 | $2,015 | $207,680 | $0 | $0 |
2023 | $1,976 | $203,940 | $0 | $0 |
2022 | $2,097 | $212,245 | $0 | $0 |
2021 | $1,773 | $287,000 | $102,600 | $184,400 |
2020 | $1,598 | $251,600 | $85,500 | $166,100 |
2019 | $1,388 | $229,900 | $85,500 | $144,400 |
2018 | $1,354 | $216,700 | $85,500 | $131,200 |
2017 | $1,183 | $101,750 | $0 | $0 |
2016 | $1,005 | $85,305 | $0 | $0 |
2015 | $920 | $77,220 | $0 | $0 |
2014 | $856 | $72,050 | $0 | $0 |
Source: Public Records
Map
Nearby Homes
- 272 E 200 N
- 390 E Center St
- 844 S 200 E Unit 4-204
- 844 S 200 E Unit 4 -201
- 844 S 200 E Unit 3-304
- 844 S 200 E Unit 3-202
- 844 S 200 E Unit 3-101
- 385 E 300 N
- 243 S 300 E
- 390 N 100 E
- 312 S 200 E
- 380 N 100 W
- 298 S St Unit 205
- 279 S St
- 279 S St Unit 21
- 276 S St Unit 20
- 543 E 400 N
- 165 E 400 S
- 279 N 200 W
- 324 S St Unit 204