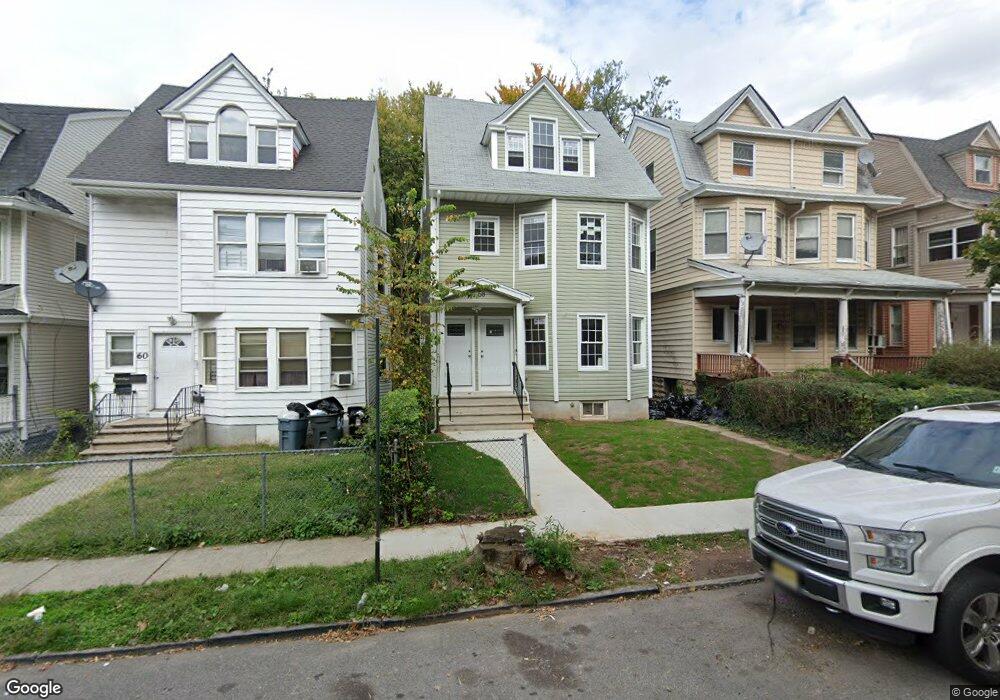
58 New St Unit 2 East Orange, NJ 07017
Estimated Value: $723,000 - $940,000
--
Bed
--
Bath
3,422
Sq Ft
$246/Sq Ft
Est. Value
About This Home
This home is located at 58 New St Unit 2, East Orange, NJ 07017 and is currently estimated at $841,288, approximately $245 per square foot. 58 New St Unit 2 is a home located in Essex County with nearby schools including Mildred B. Garvin School, John L Costley Middle School, and Patrick F Healy Middle School.
Ownership History
Date
Name
Owned For
Owner Type
Purchase Details
Closed on
Jun 8, 2022
Sold by
Forbes Danielle
Bought by
Osuwah Chisom
Current Estimated Value
Home Financials for this Owner
Home Financials are based on the most recent Mortgage that was taken out on this home.
Original Mortgage
$648,045
Outstanding Balance
$619,107
Interest Rate
5.75%
Mortgage Type
FHA
Estimated Equity
$222,181
Purchase Details
Closed on
Mar 22, 2021
Sold by
Kearny Jameel H and Kearney Jameel H
Bought by
Forbes Danielle
Home Financials for this Owner
Home Financials are based on the most recent Mortgage that was taken out on this home.
Original Mortgage
$480,164
Interest Rate
3%
Mortgage Type
FHA
Purchase Details
Closed on
Aug 29, 2012
Sold by
Kings Investments Ll
Bought by
58 New Street Holdings Llc
Purchase Details
Closed on
Feb 24, 2012
Sold by
Royal Tax Lien Services Llc
Bought by
Kings Investments Llc
Create a Home Valuation Report for This Property
The Home Valuation Report is an in-depth analysis detailing your home's value as well as a comparison with similar homes in the area
Home Values in the Area
Average Home Value in this Area
Purchase History
| Date | Buyer | Sale Price | Title Company |
|---|---|---|---|
| Osuwah Chisom | $670,000 | Carnegie Title | |
| Forbes Danielle | $500,000 | Foundation Title Llc | |
| 58 New Street Holdings Llc | $62,000 | -- | |
| Kings Investments Llc | $39,900 | East Coast Title & Settlemen |
Source: Public Records
Mortgage History
| Date | Status | Borrower | Loan Amount |
|---|---|---|---|
| Open | Osuwah Chisom | $648,045 | |
| Previous Owner | Forbes Danielle | $480,164 |
Source: Public Records
Tax History Compared to Growth
Tax History
| Year | Tax Paid | Tax Assessment Tax Assessment Total Assessment is a certain percentage of the fair market value that is determined by local assessors to be the total taxable value of land and additions on the property. | Land | Improvement |
|---|---|---|---|---|
| 2025 | $20,852 | $658,200 | $67,900 | $590,300 |
| 2024 | $20,852 | $658,200 | $67,900 | $590,300 |
| 2022 | $15,411 | $530,300 | $67,900 | $462,400 |
| 2021 | $12,584 | $227,100 | $57,900 | $169,200 |
| 2020 | $6,438 | $117,700 | $57,900 | $59,800 |
| 2019 | $6,356 | $117,700 | $57,900 | $59,800 |
| 2018 | $6,288 | $117,900 | $57,900 | $60,000 |
| 2017 | $9,410 | $117,900 | $57,900 | $60,000 |
| 2016 | $9,410 | $184,400 | $57,900 | $126,500 |
| 2015 | $9,179 | $184,400 | $57,900 | $126,500 |
| 2014 | $9,050 | $184,400 | $57,900 | $126,500 |
Source: Public Records
Map
Nearby Homes
- 92 N Oraton Pkwy
- 80 N Oraton Pkwy
- 57 New St
- 133 N Maple Ave Unit 204
- 39 New St
- 256 William St
- 100 N Munn Ave
- 79 N Munn Ave
- 118 N Grove St
- 90 N Grove St
- 65 N Grove St
- 182 N Maple Ave
- 43 Grove Place
- 61 N Grove St
- 129 Greenwood Ave
- 147 Greenwood Ave
- 63 Stockton Place
- 152 Greenwood Ave Unit 2
- 83 N 19th St
- 97 N 19th St