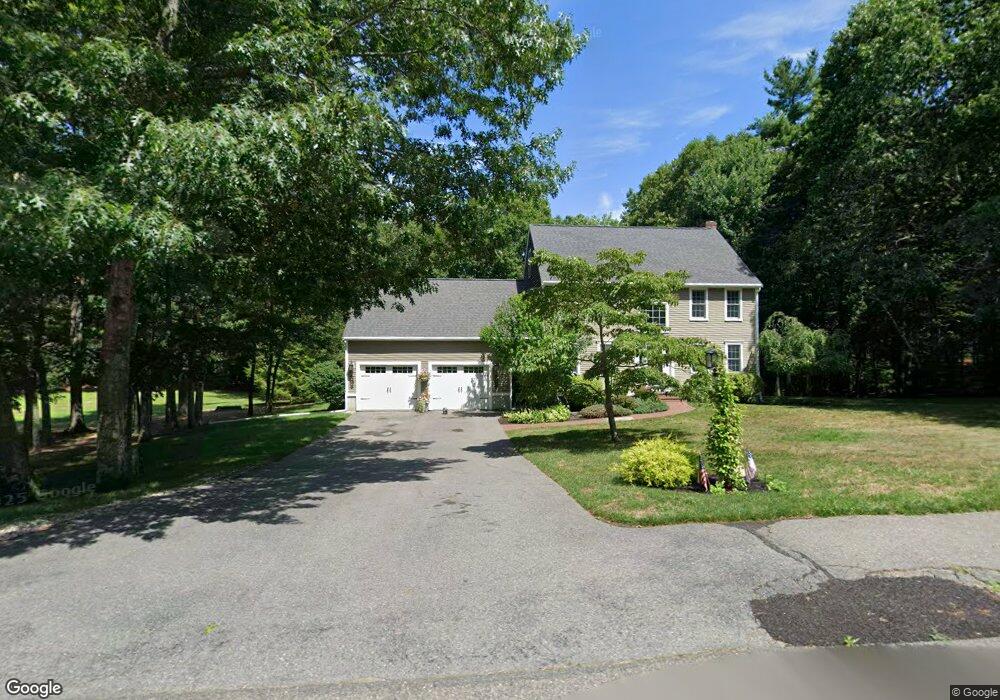
58 Newcombs Mill Rd Kingston, MA 02364
Estimated Value: $678,000 - $978,000
3
Beds
3
Baths
2,490
Sq Ft
$333/Sq Ft
Est. Value
About This Home
This home is located at 58 Newcombs Mill Rd, Kingston, MA 02364 and is currently estimated at $829,253, approximately $333 per square foot. 58 Newcombs Mill Rd is a home located in Plymouth County with nearby schools including Silver Lake Regional High School, Kingston Elementary School, and Kingston Intermediate School.
Ownership History
Date
Name
Owned For
Owner Type
Purchase Details
Closed on
Dec 18, 2023
Sold by
Gay Robert A and Gay Katleen A
Bought by
Gay Ft and Gay
Current Estimated Value
Purchase Details
Closed on
Jul 13, 2001
Sold by
Moore Michael D and Moore Pamela K
Bought by
Gay Robert A and Gay Kathleen A
Purchase Details
Closed on
Dec 4, 1998
Sold by
Guevremont Louis J and Guevremont Donna M
Bought by
Moore Michael D and Moore Pamela K
Purchase Details
Closed on
Nov 1, 1995
Sold by
Goscon Inc
Bought by
Guevremont Louis J and Guevremont Donna M
Purchase Details
Closed on
Aug 31, 1995
Sold by
Nutter Ft and Nutter
Bought by
Goscon Inc
Create a Home Valuation Report for This Property
The Home Valuation Report is an in-depth analysis detailing your home's value as well as a comparison with similar homes in the area
Home Values in the Area
Average Home Value in this Area
Purchase History
We collect this data history from publicly available records. To have your information removed, we recommend requesting removal directly through your county’s website.
| Date | Buyer | Sale Price | Title Company |
|---|---|---|---|
| Gay Ft | -- | None Available | |
| Gay Ft | -- | None Available | |
| Gay Robert A | $369,000 | -- | |
| Moore Michael D | $253,500 | -- | |
| Guevremont Louis J | $210,000 | -- | |
| Goscon Inc | $67,500 | -- | |
| Gay Robert A | $369,000 | -- | |
| Moore Michael D | $253,500 | -- | |
| Guevremont Louis J | $210,000 | -- | |
| Goscon Inc | $67,500 | -- |
Source: Public Records
Mortgage History
We collect this data history from publicly available records. To have your information removed, we recommend requesting removal directly through your county’s website.
| Date | Status | Borrower | Loan Amount |
|---|---|---|---|
| Previous Owner | Goscon Inc | $357,210 | |
| Previous Owner | Goscon Inc | $45,000 |
Source: Public Records
Tax History
| Year | Tax Paid | Tax Assessment Tax Assessment Total Assessment is a certain percentage of the fair market value that is determined by local assessors to be the total taxable value of land and additions on the property. | Land | Improvement |
|---|---|---|---|---|
| 2025 | $8,773 | $676,400 | $215,800 | $460,600 |
| 2024 | $8,064 | $634,500 | $215,800 | $418,700 |
| 2023 | $7,745 | $579,700 | $215,800 | $363,900 |
| 2022 | $7,587 | $520,400 | $191,300 | $329,100 |
| 2021 | $7,714 | $479,700 | $191,300 | $288,400 |
| 2020 | $7,640 | $469,300 | $191,300 | $278,000 |
| 2019 | $7,498 | $455,500 | $191,300 | $264,200 |
| 2018 | $6,981 | $424,400 | $191,300 | $233,100 |
| 2017 | $6,714 | $406,900 | $182,900 | $224,000 |
| 2016 | $6,398 | $363,300 | $173,100 | $190,200 |
| 2015 | $6,209 | $366,500 | $173,100 | $193,400 |
| 2014 | $6,215 | $372,600 | $176,000 | $196,600 |
Source: Public Records
Map
Nearby Homes
- 7 Nobadeer Cir
- 2 Morgans Way
- 8 Charles Dr
- 46 Foxworth Ln
- 64 Wapping Rd
- 19 Lodgepole Ln
- 15 Forest St
- 6 Station St
- 7 Barbara Rd
- 10 Wapping Rd
- 31 Maple St
- 78 Indian Pond Rd
- 70 Indian Pond Rd
- 68 Elm St Unit 68
- 32 Crescent St
- 23 Green Holly Dr Unit 23
- 1 Sycamore Dr
- 4 Green Holly Dr
- 11 Center St
- 75 Evergreen St Unit 75
- 52 Newcombs Mill Rd
- 64 Newcombs Mill Rd
- 53 Newcombs Mill Rd
- 59 Newcombs Mill Rd
- 45 Walter Faunce Rd
- 63 Walter Faunce Rd
- 65 Newcombs Mill Rd
- 46 Newcombs Mill Rd
- 68 Newcombs Mill Rd
- 47 Newcombs Mill Rd
- 62 Higgins Rd
- 58 Higgins Rd
- 35 Walter Faunce Rd
- 40 Walter Faunce Rd
- 68 Higgins Rd
- 71 Newcombs Mill Rd
- 54 Walter Faunce Rd
- 52 Higgins Rd
- 103 Lot Phillips Rd
- 60 Walter Faunce Rd
Your Personal Tour Guide
Ask me questions while you tour the home.