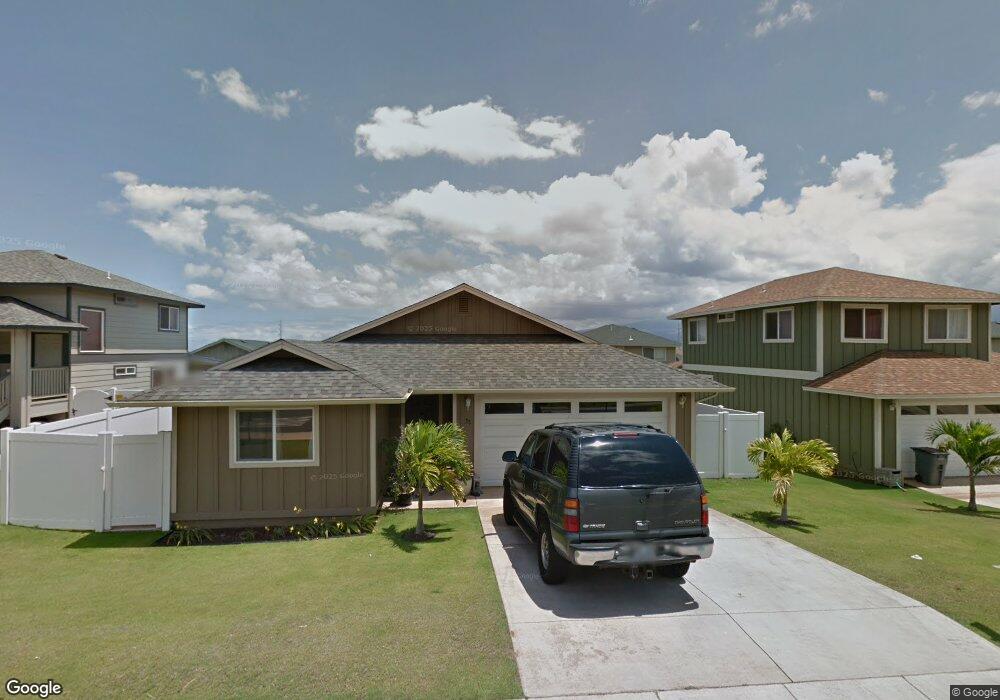
58 Nokekula Loop Unit 227 Wailuku, HI 96793
Estimated Value: $1,076,000 - $1,121,000
3
Beds
2
Baths
1,454
Sq Ft
$752/Sq Ft
Est. Value
About This Home
This home is located at 58 Nokekula Loop Unit 227, Wailuku, HI 96793 and is currently estimated at $1,094,002, approximately $752 per square foot. 58 Nokekula Loop Unit 227 is a home located in Maui County with nearby schools including Puu Kukui Elementary School, Maui Waena Intermediate School, and Maui High School.
Ownership History
Date
Name
Owned For
Owner Type
Purchase Details
Closed on
May 15, 2018
Sold by
Lozano Andrew and Lozano Sharon
Bought by
Lozano Andrew and Lozano Sharon
Current Estimated Value
Purchase Details
Closed on
Jan 11, 2017
Sold by
Gebrael Jorge M and Villaca Marina
Bought by
Lozano Andrew and Lozano Sharon
Purchase Details
Closed on
Dec 30, 2014
Sold by
Funakoshi Erik and Funakoshi Jaime
Bought by
Gebrael Jorge M and Villaca Marina
Home Financials for this Owner
Home Financials are based on the most recent Mortgage that was taken out on this home.
Original Mortgage
$498,307
Interest Rate
3.5%
Mortgage Type
FHA
Purchase Details
Closed on
Sep 23, 2008
Sold by
Spencer Homes Inc
Bought by
Funakoshi Erik and Funakoshi Jaime
Home Financials for this Owner
Home Financials are based on the most recent Mortgage that was taken out on this home.
Original Mortgage
$362,995
Interest Rate
6.49%
Mortgage Type
Unknown
Create a Home Valuation Report for This Property
The Home Valuation Report is an in-depth analysis detailing your home's value as well as a comparison with similar homes in the area
Home Values in the Area
Average Home Value in this Area
Purchase History
| Date | Buyer | Sale Price | Title Company |
|---|---|---|---|
| Lozano Andrew | -- | None Available | |
| Lozano Andrew | -- | Or | |
| Gebrael Jorge M | $507,500 | Or | |
| Funakoshi Erik | $382,100 | Tg |
Source: Public Records
Mortgage History
| Date | Status | Borrower | Loan Amount |
|---|---|---|---|
| Previous Owner | Gebrael Jorge M | $498,307 | |
| Previous Owner | Funakoshi Erik | $362,995 |
Source: Public Records
Tax History Compared to Growth
Tax History
| Year | Tax Paid | Tax Assessment Tax Assessment Total Assessment is a certain percentage of the fair market value that is determined by local assessors to be the total taxable value of land and additions on the property. | Land | Improvement |
|---|---|---|---|---|
| 2025 | $930 | $945,100 | $549,700 | $395,400 |
| 2024 | $930 | $816,600 | $439,800 | $376,800 |
| 2023 | $906 | $776,800 | $399,800 | $377,000 |
| 2022 | $934 | $666,800 | $324,800 | $342,000 |
| 2021 | $1,033 | $628,700 | $309,900 | $318,800 |
| 2020 | $1,066 | $624,700 | $299,900 | $324,800 |
| 2019 | $1,103 | $580,200 | $264,900 | $315,300 |
| 2018 | $1,065 | $573,700 | $204,900 | $368,800 |
| 2017 | $3,010 | $0 | $0 | $0 |
| 2016 | $898 | $532,500 | $189,900 | $342,600 |
| 2015 | $255 | $456,800 | $189,900 | $266,900 |
Source: Public Records
Map
Nearby Homes
- 159 Iniiniki St
- 801 Haawi St
- 232 Kamahao Cir
- 80 Koani Loop
- 43 & 45 Moolu St
- 60 Wilikona Place
- 1520 Kilinoe Place
- 103 Moolu Cir Unit 103 Moolu
- 302 Kama St
- 147 Moolu Cir
- 24 Paa St Unit 53A
- 104 Maa St Unit Lot 29
- 124 Kapela Place
- 62 Meheu Cir
- 95 Meheu Cir
- 729 S Alu Rd
- 103 Unahe St Unit Lot 128-B
- 109 Unahe St Unit Lot 131-A
- 105 Unahe St Unit Lot 129A
- 93 Unahe St Unit Lot 125-B
- 58 Nokekula Loop
- 62 Nokekula Loop
- 62 Nokekula Loop Unit 228
- 54 Nokekula Loop
- 54 Nokekula Loop Unit Lot 226
- 168 Kaikai St
- 168 Kaikai St Unit Lot 233
- 168 Ka'Ika'i St Unit Lot 233
- 164 Kaikai St
- 32 Nokekula Loop
- 32 Nokekula Loop Unit Lot 232
- 164 Ka'Ika'i St Unit Lot 234
- 66 Nokekula Loop
- 66 Nokekula Loop Unit Lot 229
- 160 Kaikai St
- 59 Nokekula Loop
- 59 Nokekula Loop Unit Lot 210
- 160 Ka'Ika'i St Unit Lot 235
- 63 Nokekula Loop
- 63 Nokekula Loop Unit Lot 211