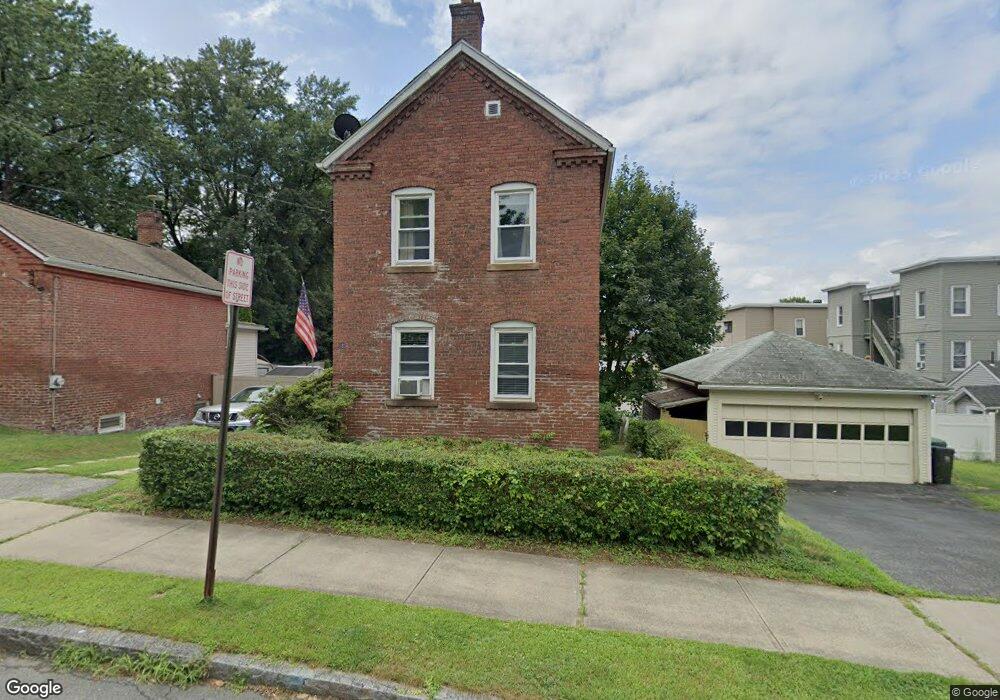
58 Nonotuck Ave Chicopee, MA 01013
Chicopee Center NeighborhoodEstimated Value: $221,000 - $261,702
2
Beds
1
Bath
1,120
Sq Ft
$207/Sq Ft
Est. Value
About This Home
This home is located at 58 Nonotuck Ave, Chicopee, MA 01013 and is currently estimated at $232,176, approximately $207 per square foot. 58 Nonotuck Ave is a home located in Hampden County with nearby schools including Bowe Elementary School, Fairview Middle School, and Chicopee High School.
Ownership History
Date
Name
Owned For
Owner Type
Purchase Details
Closed on
Apr 1, 2008
Sold by
Derby Ann S and Buczko Theresa M
Bought by
Baker Ft
Current Estimated Value
Home Financials for this Owner
Home Financials are based on the most recent Mortgage that was taken out on this home.
Original Mortgage
$42,500
Outstanding Balance
$26,626
Interest Rate
5.76%
Mortgage Type
Purchase Money Mortgage
Estimated Equity
$205,550
Purchase Details
Closed on
Jun 26, 2007
Sold by
Szukala Mildred
Bought by
Derby Ann S and Szukala Mildred
Create a Home Valuation Report for This Property
The Home Valuation Report is an in-depth analysis detailing your home's value as well as a comparison with similar homes in the area
Home Values in the Area
Average Home Value in this Area
Purchase History
| Date | Buyer | Sale Price | Title Company |
|---|---|---|---|
| Baker Ft | $85,000 | -- | |
| Derby Ann S | -- | -- |
Source: Public Records
Mortgage History
| Date | Status | Borrower | Loan Amount |
|---|---|---|---|
| Open | Baker Ft | $42,500 |
Source: Public Records
Tax History
| Year | Tax Paid | Tax Assessment Tax Assessment Total Assessment is a certain percentage of the fair market value that is determined by local assessors to be the total taxable value of land and additions on the property. | Land | Improvement |
|---|---|---|---|---|
| 2025 | $2,618 | $172,700 | $50,600 | $122,100 |
| 2024 | $2,483 | $168,200 | $49,600 | $118,600 |
| 2023 | $2,333 | $154,000 | $45,100 | $108,900 |
| 2022 | $2,231 | $131,300 | $39,200 | $92,100 |
| 2021 | $2,108 | $119,700 | $35,600 | $84,100 |
| 2020 | $1,997 | $114,400 | $35,600 | $78,800 |
| 2019 | $1,959 | $109,100 | $35,600 | $73,500 |
| 2018 | $1,902 | $103,900 | $33,900 | $70,000 |
| 2017 | $1,908 | $110,200 | $39,200 | $71,000 |
| 2016 | $1,850 | $109,400 | $39,200 | $70,200 |
| 2015 | $1,863 | $106,200 | $39,200 | $67,000 |
| 2014 | $931 | $106,200 | $39,200 | $67,000 |
Source: Public Records
Map
Nearby Homes
- 57- 59 Stearns Terrace
- 27 Abbey St
- 13 Beston St
- 0 School St
- 69 Beston St
- 35 Dublin St
- 21 Depot St
- 2 Marion St
- Lot 1 Marion St
- 35 Lower Grape St
- 438 Front St
- 85 Orchard St
- 0 Nelson St
- 80 Brush Hill Ave Unit 61
- 87 Blanchwood Ave
- 29 Sunnymeade Ave
- 15 Hyde Ave
- 103 Ontario St
- 1078 Liberty St
- 51 Beaumont Ave
Your Personal Tour Guide
Ask me questions while you tour the home.