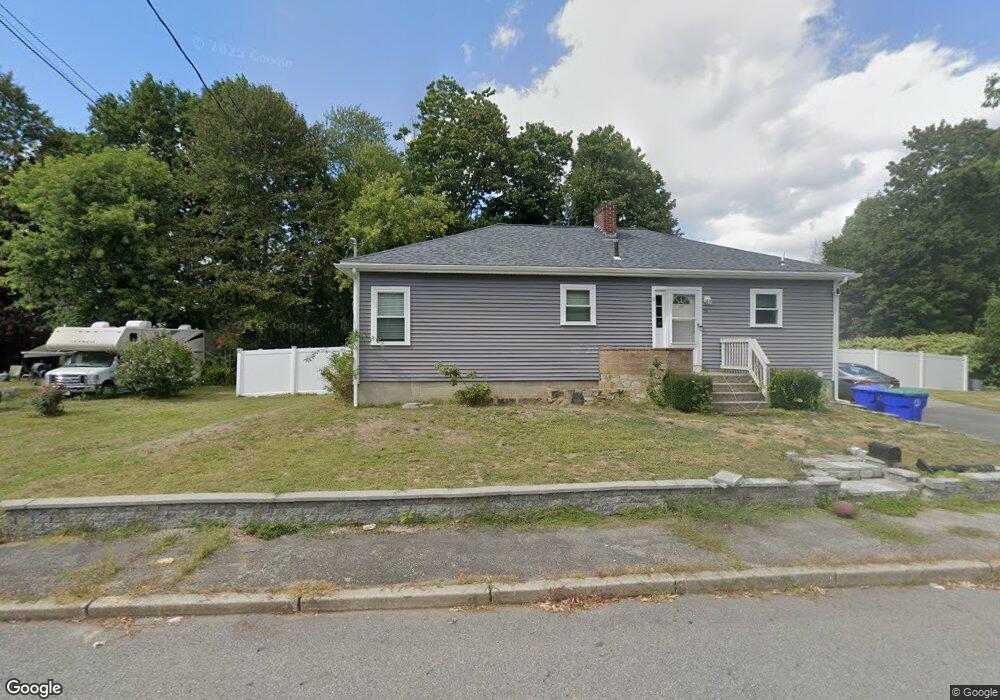
58 Norman St Rockland, MA 02370
Estimated Value: $532,000 - $569,000
3
Beds
1
Bath
1,134
Sq Ft
$483/Sq Ft
Est. Value
About This Home
This home is located at 58 Norman St, Rockland, MA 02370 and is currently estimated at $547,726, approximately $483 per square foot. 58 Norman St is a home located in Plymouth County with nearby schools including Rockland Senior High School, Calvary Chapel Academy, and Holy Family Elementary School.
Ownership History
Date
Name
Owned For
Owner Type
Purchase Details
Closed on
Dec 4, 2009
Sold by
Mcgarry William J and Gouldrup Janet L
Bought by
Rattigan Michael L and Hannon Nicole J
Current Estimated Value
Home Financials for this Owner
Home Financials are based on the most recent Mortgage that was taken out on this home.
Original Mortgage
$219,600
Outstanding Balance
$144,042
Interest Rate
5.01%
Mortgage Type
Purchase Money Mortgage
Estimated Equity
$403,684
Create a Home Valuation Report for This Property
The Home Valuation Report is an in-depth analysis detailing your home's value as well as a comparison with similar homes in the area
Home Values in the Area
Average Home Value in this Area
Purchase History
| Date | Buyer | Sale Price | Title Company |
|---|---|---|---|
| Rattigan Michael L | $219,600 | -- |
Source: Public Records
Mortgage History
| Date | Status | Borrower | Loan Amount |
|---|---|---|---|
| Open | Rattigan Michael L | $219,600 |
Source: Public Records
Tax History Compared to Growth
Tax History
| Year | Tax Paid | Tax Assessment Tax Assessment Total Assessment is a certain percentage of the fair market value that is determined by local assessors to be the total taxable value of land and additions on the property. | Land | Improvement |
|---|---|---|---|---|
| 2025 | $6,347 | $464,300 | $228,700 | $235,600 |
| 2024 | $6,158 | $438,000 | $215,700 | $222,300 |
| 2023 | $6,118 | $402,000 | $197,900 | $204,100 |
| 2022 | $5,690 | $339,700 | $172,100 | $167,600 |
| 2021 | $5,236 | $303,000 | $156,400 | $146,600 |
| 2020 | $8,665 | $288,600 | $149,000 | $139,600 |
| 2019 | $8,448 | $275,100 | $141,900 | $133,200 |
| 2018 | $4,431 | $243,200 | $141,900 | $101,300 |
| 2017 | $7,810 | $234,100 | $141,900 | $92,200 |
| 2016 | $4,166 | $225,300 | $136,500 | $88,800 |
| 2015 | $3,730 | $196,000 | $127,500 | $68,500 |
| 2014 | $3,547 | $193,400 | $125,100 | $68,300 |
Source: Public Records
Map
Nearby Homes
- 149 Concord St
- 133 Crescent St
- 440 Market St
- 94-96 Crescent St
- 49 Liberty St
- 92 Liberty St
- 38 Levin Rd
- 133 Spring St
- 20 Pat Rose Way
- 19 Pat Rose Way
- 6 Pat Rose Way
- 8 Pat Rose Way
- 17 Pat Rose Way
- 140 W Water St
- 86 Damon Rd
- 718 Market St
- 810 Brookline Way
- 50 Linden Park
- 225 W Water St
- 103 Grove St Unit 337