Estimated Value: $886,000 - $1,019,000
4
Beds
5
Baths
3,722
Sq Ft
$254/Sq Ft
Est. Value
About This Home
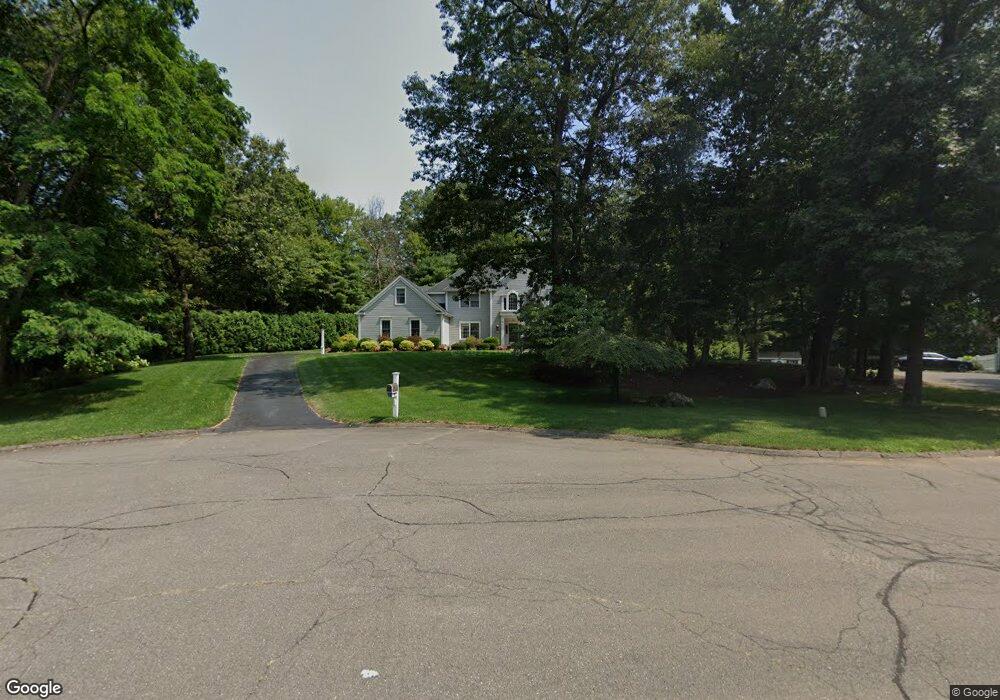
This home is located at 58 Orchard Farms Ln, Avon, CT 06001 and is currently estimated at $947,173, approximately $254 per square foot. 58 Orchard Farms Ln is a home located in Hartford County with nearby schools including Roaring Brook School, Thompson Brook School, and Avon Middle School.
Ownership History
Date
Name
Owned For
Owner Type
Purchase Details
Closed on
Jan 6, 2023
Sold by
Oommen Siji
Bought by
Oommen Lt
Current Estimated Value
Purchase Details
Closed on
Jun 11, 2003
Sold by
Gray James C and Gray Nancy
Bought by
Oommen Cherian S and Oommen Siji
Home Financials for this Owner
Home Financials are based on the most recent Mortgage that was taken out on this home.
Original Mortgage
$448,000
Interest Rate
3.84%
Purchase Details
Closed on
Apr 30, 2001
Sold by
Martin Darle G and Martin Sandra Kay
Bought by
Gray James C and Gray Nancy
Purchase Details
Closed on
Aug 30, 1995
Sold by
Orchard Farms Dev Inc
Bought by
Martin Darle and Martin Sanrdra
Create a Home Valuation Report for This Property
The Home Valuation Report is an in-depth analysis detailing your home's value as well as a comparison with similar homes in the area
Home Values in the Area
Average Home Value in this Area
Purchase History
| Date | Buyer | Sale Price | Title Company |
|---|---|---|---|
| Oommen Lt | -- | None Available | |
| Oommen Lt | -- | None Available | |
| Oommen Cherian S | $560,000 | -- | |
| Oommen Cherian S | $560,000 | -- | |
| Gray James C | $480,000 | -- | |
| Gray James C | $480,000 | -- | |
| Martin Darle | $406,900 | -- | |
| Martin Darle | $406,900 | -- |
Source: Public Records
Mortgage History
| Date | Status | Borrower | Loan Amount |
|---|---|---|---|
| Previous Owner | Martin Darle | $275,000 | |
| Previous Owner | Martin Darle | $469,000 | |
| Previous Owner | Martin Darle | $448,000 |
Source: Public Records
Tax History Compared to Growth
Tax History
| Year | Tax Paid | Tax Assessment Tax Assessment Total Assessment is a certain percentage of the fair market value that is determined by local assessors to be the total taxable value of land and additions on the property. | Land | Improvement |
|---|---|---|---|---|
| 2025 | $14,490 | $471,230 | $123,050 | $348,180 |
| 2024 | $13,977 | $471,230 | $123,050 | $348,180 |
| 2023 | $13,583 | $383,810 | $105,550 | $278,260 |
| 2022 | $13,284 | $383,810 | $105,550 | $278,260 |
| 2021 | $13,130 | $383,810 | $105,550 | $278,260 |
| 2020 | $12,627 | $383,810 | $105,550 | $278,260 |
| 2019 | $12,627 | $383,810 | $105,550 | $278,260 |
| 2018 | $12,195 | $388,990 | $105,550 | $283,440 |
| 2017 | $11,899 | $388,990 | $105,550 | $283,440 |
| 2016 | $11,193 | $379,160 | $105,550 | $273,610 |
| 2015 | $10,920 | $379,160 | $105,550 | $273,610 |
| 2014 | $10,591 | $373,960 | $105,550 | $268,410 |
Source: Public Records
Map
Nearby Homes
- 4 Orchard Farms Ln
- 3 Putnam Ln Unit 3
- 94 Sanford Ave
- 5 Homestead Ln
- 33 Forge Dr
- 6 Redwood Ln Unit 6
- 10 Taine Mountain Rd
- 40 Donna Dr
- 148 River Rd
- 8919 Taine Mountain Rd
- 40 Homestead Ln
- 61 Chevas Rd
- 159 Haynes Rd
- 115 W Avon Rd
- 16 Chevas Rd
- 2 Muirfield Ln
- 9 Sedgewood Rd
- 455 Lovely St
- 57 New Britain Ave Unit 59
- 34 Terrace Dr