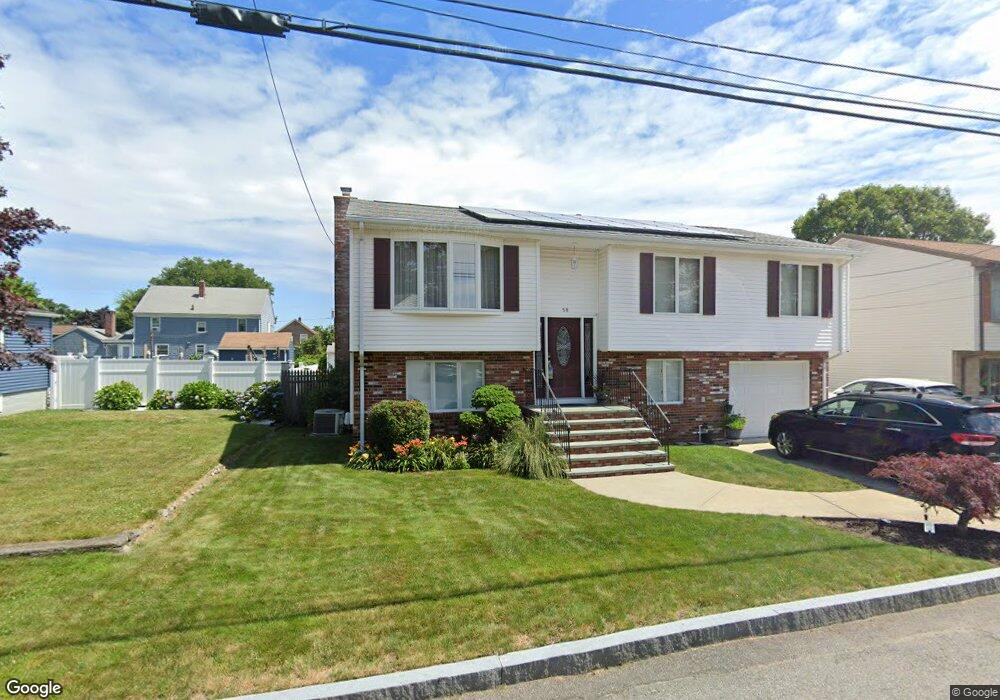
58 Pershing St East Providence, RI 02914
Estimated Value: $424,000 - $496,000
3
Beds
2
Baths
1,976
Sq Ft
$236/Sq Ft
Est. Value
About This Home
This home is located at 58 Pershing St, East Providence, RI 02914 and is currently estimated at $466,539, approximately $236 per square foot. 58 Pershing St is a home located in Providence County with nearby schools including East Providence High School, Ocean State Montessori School, and Lincoln School.
Ownership History
Date
Name
Owned For
Owner Type
Purchase Details
Closed on
Jul 2, 2001
Sold by
Pepin Robert P and Pepin Deborah R
Bought by
Silva Maria F
Current Estimated Value
Home Financials for this Owner
Home Financials are based on the most recent Mortgage that was taken out on this home.
Original Mortgage
$75,000
Outstanding Balance
$28,569
Interest Rate
7.14%
Mortgage Type
Purchase Money Mortgage
Estimated Equity
$437,970
Purchase Details
Closed on
Jan 28, 1983
Bought by
Silva Joaquim G and Silva Maria F
Create a Home Valuation Report for This Property
The Home Valuation Report is an in-depth analysis detailing your home's value as well as a comparison with similar homes in the area
Home Values in the Area
Average Home Value in this Area
Purchase History
| Date | Buyer | Sale Price | Title Company |
|---|---|---|---|
| Silva Maria F | $105,000 | -- | |
| Silva Joaquim G | $14,000 | -- | |
| Silva Maria F | $105,000 | -- |
Source: Public Records
Mortgage History
| Date | Status | Borrower | Loan Amount |
|---|---|---|---|
| Open | Silva Joaquim G | $30,000 | |
| Open | Silva Joaquim G | $75,000 | |
| Closed | Silva Joaquim G | $75,000 | |
| Previous Owner | Silva Joaquim G | $34,000 |
Source: Public Records
Tax History Compared to Growth
Tax History
| Year | Tax Paid | Tax Assessment Tax Assessment Total Assessment is a certain percentage of the fair market value that is determined by local assessors to be the total taxable value of land and additions on the property. | Land | Improvement |
|---|---|---|---|---|
| 2025 | $5,874 | $449,400 | $120,100 | $329,300 |
| 2024 | $5,973 | $389,600 | $100,000 | $289,600 |
| 2023 | $5,750 | $389,600 | $100,000 | $289,600 |
| 2022 | $5,590 | $255,700 | $46,600 | $209,100 |
| 2021 | $5,498 | $255,700 | $44,700 | $211,000 |
| 2020 | $5,265 | $255,700 | $44,700 | $211,000 |
| 2019 | $5,119 | $255,700 | $44,700 | $211,000 |
| 2018 | $5,370 | $234,700 | $45,200 | $189,500 |
| 2017 | $5,250 | $234,700 | $45,200 | $189,500 |
| 2016 | $5,224 | $234,700 | $45,200 | $189,500 |
| 2015 | $4,886 | $212,900 | $41,800 | $171,100 |
| 2014 | $4,886 | $212,900 | $41,800 | $171,100 |
Source: Public Records
Map
Nearby Homes
- 200 Woodward Ave
- 115 Sutton Ave
- 674 N Broadway
- 30 Metacomet Ave
- 270 Woodward Ave
- 172 Ivy St
- 120 Williams Ave
- 56 Irving Ave
- 13 Central Ave
- 91 Ivy St
- 94 Anthony St Unit 96
- 54 Dalton St
- 157 Grosvenor Ave
- 132 E Point Dr
- 114 E Point Dr
- 125 Roger Williams Ave
- 58 Summit St
- 141 E Point Dr Unit 401
- 141 E Point Dr Unit 105
- 141 E Point Dr Unit 306