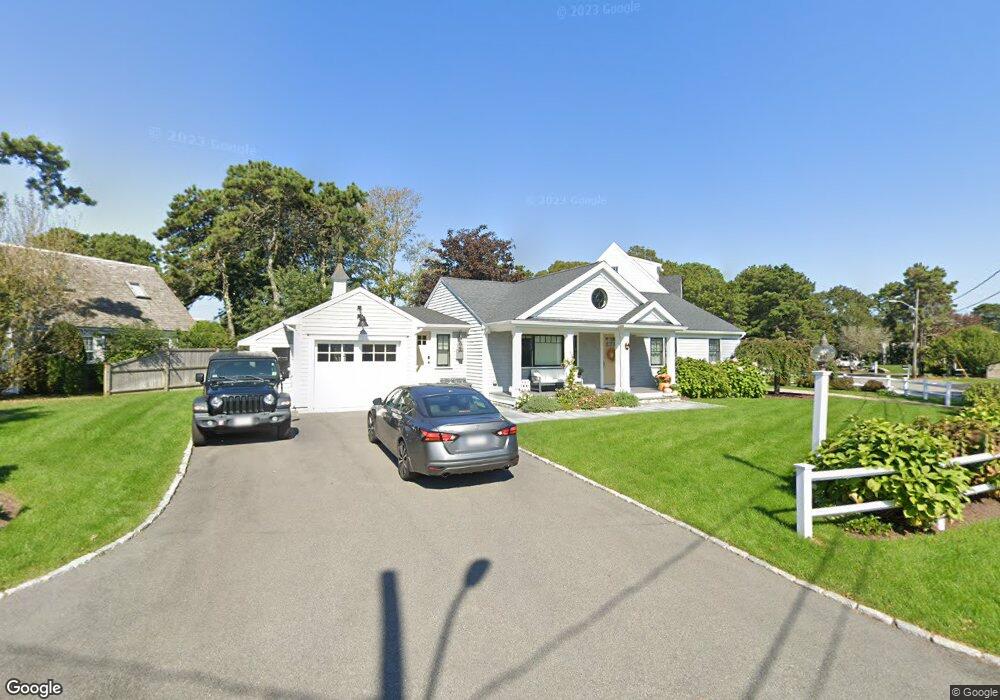
58 Porter Ln West Dennis, MA 02670
West Dennis NeighborhoodEstimated Value: $1,202,000 - $1,506,791
3
Beds
2
Baths
1,188
Sq Ft
$1,182/Sq Ft
Est. Value
About This Home
This home is located at 58 Porter Ln, West Dennis, MA 02670 and is currently estimated at $1,404,698, approximately $1,182 per square foot. 58 Porter Ln is a home located in Barnstable County with nearby schools including Dennis-Yarmouth Regional High School and St. Pius X. School.
Ownership History
Date
Name
Owned For
Owner Type
Purchase Details
Closed on
Aug 27, 2008
Sold by
Curry Patricia C and Curry Robert F
Bought by
Patricia C Curry Ret and Curry Patricia C
Current Estimated Value
Purchase Details
Closed on
Jun 12, 2007
Sold by
Kenney Ivan D
Bought by
Curry Patricia C and Curry Robert P
Home Financials for this Owner
Home Financials are based on the most recent Mortgage that was taken out on this home.
Original Mortgage
$415,000
Interest Rate
6.17%
Mortgage Type
Purchase Money Mortgage
Create a Home Valuation Report for This Property
The Home Valuation Report is an in-depth analysis detailing your home's value as well as a comparison with similar homes in the area
Home Values in the Area
Average Home Value in this Area
Purchase History
| Date | Buyer | Sale Price | Title Company |
|---|---|---|---|
| Patricia C Curry Ret | -- | -- | |
| Curry Patricia C | $639,000 | -- |
Source: Public Records
Mortgage History
| Date | Status | Borrower | Loan Amount |
|---|---|---|---|
| Previous Owner | Curry Patricia C | $415,000 |
Source: Public Records
Tax History Compared to Growth
Tax History
| Year | Tax Paid | Tax Assessment Tax Assessment Total Assessment is a certain percentage of the fair market value that is determined by local assessors to be the total taxable value of land and additions on the property. | Land | Improvement |
|---|---|---|---|---|
| 2025 | $5,563 | $1,284,800 | $522,900 | $761,900 |
| 2024 | $5,483 | $1,249,000 | $502,900 | $746,100 |
| 2023 | $5,302 | $1,135,400 | $457,100 | $678,300 |
| 2022 | $4,866 | $868,900 | $370,600 | $498,300 |
| 2021 | $40 | $819,100 | $363,300 | $455,800 |
| 2020 | $4,634 | $759,600 | $346,000 | $413,600 |
| 2019 | $26 | $707,300 | $339,300 | $368,000 |
| 2018 | $2,787 | $562,800 | $323,000 | $239,800 |
| 2017 | $3,414 | $555,200 | $323,000 | $232,200 |
| 2016 | $3,507 | $537,100 | $339,100 | $198,000 |
| 2015 | $3,437 | $537,100 | $339,100 | $198,000 |
| 2014 | $3,240 | $510,200 | $312,200 | $198,000 |
Source: Public Records
Map
Nearby Homes
- 2 Rita Mary Way
- 181 Pleasant St
- 308 Old Main St
- 745 Willow St
- 14 Schoolhouse Ln
- 17 South St
- 209 Main St Unit 3
- 209 Main St Unit 6
- 209 Main St Unit 1
- 209 Main St Unit 2
- 209 Main St Unit 4
- 209 Main St Unit 5
- 40 Kelley Rd
- 22 Powhatan Rd
- 45 Seth Ln
- 178 School St
- 23 Doric Ave
- 9 Victory Ln
- 15 Sharon Rd
- 4 Braddock St