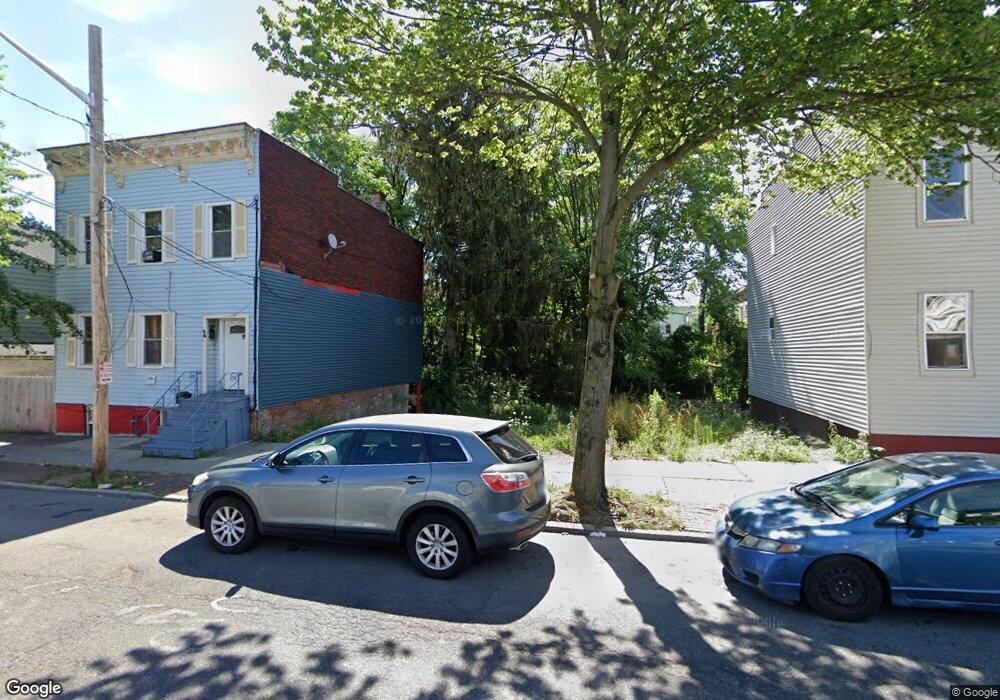
58 Quail St Albany, NY 12206
West Hill NeighborhoodEstimated Value: $23,000 - $164,000
5
Beds
2
Baths
1,408
Sq Ft
$71/Sq Ft
Est. Value
About This Home
This home is located at 58 Quail St, Albany, NY 12206 and is currently estimated at $100,000, approximately $71 per square foot. 58 Quail St is a home located in Albany County with nearby schools including Stephen And Harriet Myers Middle School, Roots Academy at West Hill, and Albany High School.
Ownership History
Date
Name
Owned For
Owner Type
Purchase Details
Closed on
Feb 15, 2017
Sold by
Devanandan Moses
Bought by
17 North Street Llc
Current Estimated Value
Purchase Details
Closed on
Oct 22, 2010
Sold by
Trustco Bank
Bought by
Devanandan Moses
Purchase Details
Closed on
Apr 28, 2010
Sold by
Tanksley Kevin and Tanksley Beverly C
Bought by
Trustco Bank
Purchase Details
Closed on
Jan 20, 2004
Sold by
Jeffries Amanda L
Bought by
Tanksley Kevin
Purchase Details
Closed on
Jan 24, 1997
Sold by
Associates Consumer Disco Unt
Bought by
Tisko Penny S and Jeffries Amanada L
Purchase Details
Closed on
Jun 27, 1996
Create a Home Valuation Report for This Property
The Home Valuation Report is an in-depth analysis detailing your home's value as well as a comparison with similar homes in the area
Home Values in the Area
Average Home Value in this Area
Purchase History
| Date | Buyer | Sale Price | Title Company |
|---|---|---|---|
| 17 North Street Llc | -- | None Available | |
| Devanandan Moses | $12,500 | None Available | |
| Trustco Bank | $20,000 | None Available | |
| Tanksley Kevin | $45,000 | Sonia Tanksley | |
| Tisko Penny S | $16,000 | -- | |
| -- | $45,434 | -- |
Source: Public Records
Tax History
| Year | Tax Paid | Tax Assessment Tax Assessment Total Assessment is a certain percentage of the fair market value that is determined by local assessors to be the total taxable value of land and additions on the property. | Land | Improvement |
|---|---|---|---|---|
| 2024 | $971 | $15,000 | $15,000 | $0 |
| 2023 | $260 | $6,600 | $6,600 | $0 |
| 2022 | $562 | $6,600 | $6,600 | $0 |
| 2021 | $562 | $6,600 | $6,600 | $0 |
| 2020 | $1,493 | $33,000 | $6,600 | $26,400 |
| 2019 | $1,866 | $33,000 | $6,600 | $26,400 |
| 2018 | $1,547 | $33,000 | $6,600 | $26,400 |
| 2017 | $885 | $33,000 | $6,600 | $26,400 |
| 2016 | $1,623 | $33,000 | $6,600 | $26,400 |
| 2015 | $1,335 | $35,000 | $12,000 | $23,000 |
| 2014 | -- | $15,000 | $12,000 | $3,000 |
Source: Public Records
Map
Nearby Homes
Your Personal Tour Guide
Ask me questions while you tour the home.