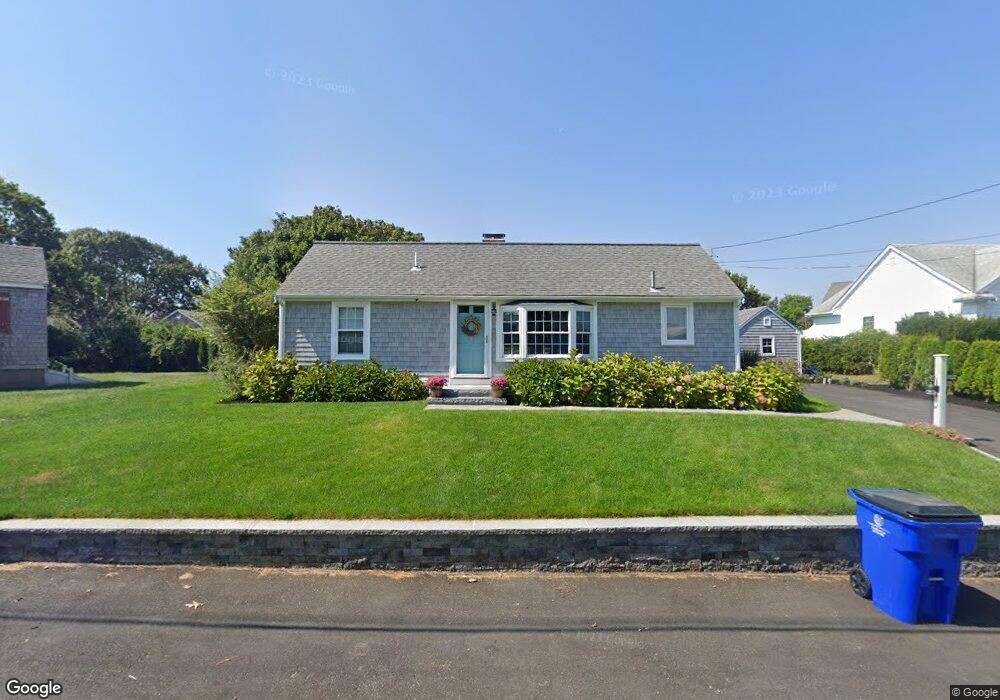
58 Rope Walk Rd Bourne, MA 2532
Estimated Value: $971,267 - $1,190,000
2
Beds
2
Baths
1,680
Sq Ft
$625/Sq Ft
Est. Value
About This Home
This home is located at 58 Rope Walk Rd, Bourne, MA 2532 and is currently estimated at $1,049,817, approximately $624 per square foot. 58 Rope Walk Rd is a home located in Barnstable County with nearby schools including Bourne High School and St Margaret Regional School.
Ownership History
Date
Name
Owned For
Owner Type
Purchase Details
Closed on
Dec 23, 2022
Sold by
Turcotte Donald R and Green Deborah A
Bought by
Powers
Current Estimated Value
Purchase Details
Closed on
Aug 29, 2016
Sold by
Barrock-Lincoln Frederic
Bought by
Turcotte Donald R and Green Deborah A
Home Financials for this Owner
Home Financials are based on the most recent Mortgage that was taken out on this home.
Original Mortgage
$345,600
Interest Rate
3.42%
Mortgage Type
New Conventional
Purchase Details
Closed on
May 24, 2011
Sold by
Swett Shirley T Est and Lincoln
Bought by
Lincoln Frederic B
Purchase Details
Closed on
Apr 13, 2010
Sold by
Shirley Townsend Swett and Shirley Lincoln
Bought by
Townsend-Swett Shirely
Create a Home Valuation Report for This Property
The Home Valuation Report is an in-depth analysis detailing your home's value as well as a comparison with similar homes in the area
Purchase History
| Date | Buyer | Sale Price | Title Company |
|---|---|---|---|
| Powers | -- | None Available | |
| Powers | -- | None Available | |
| Turcotte Donald R | $432,000 | -- | |
| Turcotte Donald R | $432,000 | -- | |
| Lincoln Frederic B | -- | -- | |
| Lincoln Frederic B | -- | -- | |
| Townsend-Swett Shirely | -- | -- | |
| Townsend-Swett Shirely | -- | -- |
Source: Public Records
Mortgage History
| Date | Status | Borrower | Loan Amount |
|---|---|---|---|
| Previous Owner | Turcotte Donald R | $345,600 |
Source: Public Records
Tax History
| Year | Tax Paid | Tax Assessment Tax Assessment Total Assessment is a certain percentage of the fair market value that is determined by local assessors to be the total taxable value of land and additions on the property. | Land | Improvement |
|---|---|---|---|---|
| 2025 | $6,888 | $881,900 | $523,500 | $358,400 |
| 2024 | $6,734 | $839,700 | $498,500 | $341,200 |
| 2023 | $6,548 | $743,200 | $441,200 | $302,000 |
| 2022 | $5,702 | $565,100 | $325,400 | $239,700 |
| 2021 | $5,539 | $514,300 | $296,100 | $218,200 |
| 2020 | $5,391 | $502,000 | $293,300 | $208,700 |
| 2019 | $5,153 | $490,300 | $293,300 | $197,000 |
| 2018 | $4,607 | $437,100 | $279,400 | $157,700 |
| 2017 | $4,800 | $466,000 | $309,900 | $156,100 |
| 2016 | $4,541 | $446,900 | $309,900 | $137,000 |
| 2015 | $5,003 | $496,800 | $359,800 | $137,000 |
Source: Public Records
Map
Nearby Homes
- 248 Great Neck Rd
- 35 Benedict Rd
- 566 Shore Rd
- 14 Navajo Rd
- 200 Great Neck Rd
- 60 Bourne Neck Dr
- 36B Starboard Dr Unit 36E
- 36B Starboard Dr Unit 36G
- 36B Starboard Dr Unit 36C
- 36B Starboard Dr Unit 36A
- 36B Starboard Dr Unit 36D
- 36B Starboard Dr Unit 36B
- 36B Starboard Dr Unit 36F
- 36B Starboard Dr Unit 36H
- 203 County Rd
- 23 Starboard Dr Unit Lot 50
- 3 Carleton St Unit 3
- 32 Carleton St Unit 32
- 10 East Blvd
- 10 East Blvd
- 58 Rope Walk Rd
- 60 Rope Walk Rd
- 57 Wianno Rd
- 59 Wianno Rd
- 59 Wianno Rd
- 56 Rope Walk Rd
- 92 Rope Walk Rd
- 92 Rope Walk Rd
- 94 Rope Walk Rd
- 62 Rope Walk Rd
- 53 Wianno Rd
- 90 Rope Walk Rd
- 53A Wianno Rd
- 90 Rope Walk Rd
- 53-A Wianno Rd
- 94 Rope Walk Rd
- 90 Rope Walk Mashnee Isl
- 61 Wianno Rd
- 45 Wianno Rd
- 96 Rope Walk Rd
Your Personal Tour Guide
Ask me questions while you tour the home.