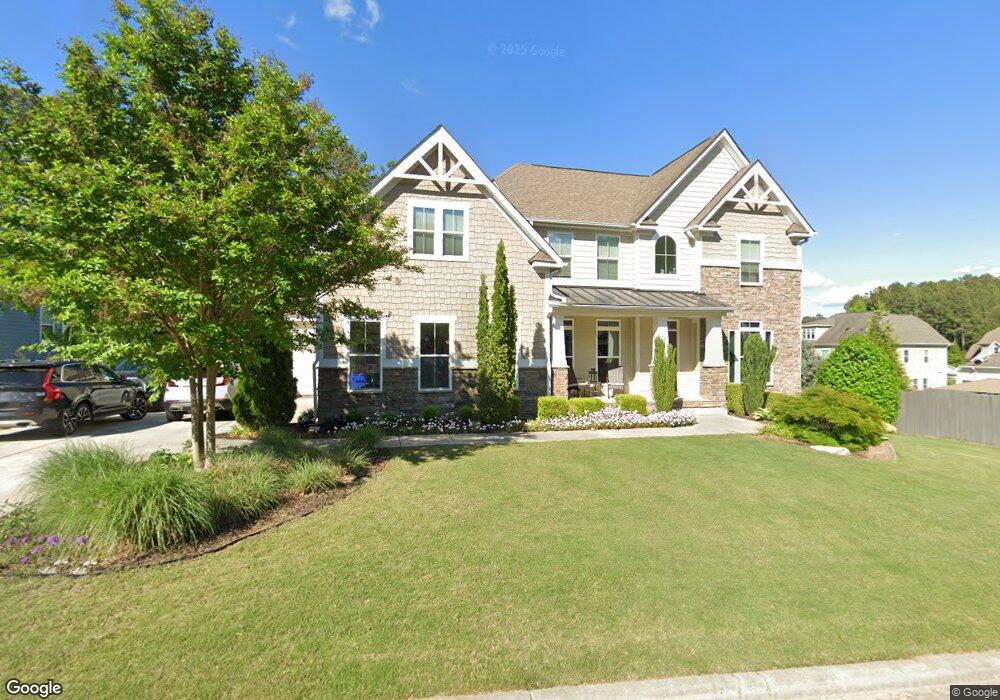
58 S Farnleigh Dr Chapel Hill, NC 27517
Estimated Value: $938,000 - $1,061,032
5
Beds
5
Baths
5,827
Sq Ft
$172/Sq Ft
Est. Value
About This Home
This home is located at 58 S Farnleigh Dr, Chapel Hill, NC 27517 and is currently estimated at $1,001,508, approximately $171 per square foot. 58 S Farnleigh Dr is a home located in Chatham County with nearby schools including North Chatham Elementary School and Margaret B. Pollard Middle School.
Ownership History
Date
Name
Owned For
Owner Type
Purchase Details
Closed on
Mar 19, 2018
Sold by
Kachhy Harsh and Kachhy Radha
Bought by
Mcinemey Michael and Mcinemey Rachel
Current Estimated Value
Home Financials for this Owner
Home Financials are based on the most recent Mortgage that was taken out on this home.
Original Mortgage
$428,000
Outstanding Balance
$245,966
Interest Rate
4.32%
Mortgage Type
New Conventional
Estimated Equity
$755,542
Purchase Details
Closed on
Sep 30, 2013
Sold by
Kacchy Harsh and Kacchy Radha
Bought by
Kacchy Harsh and Kacchy Radha
Home Financials for this Owner
Home Financials are based on the most recent Mortgage that was taken out on this home.
Original Mortgage
$356,800
Interest Rate
4.53%
Mortgage Type
New Conventional
Purchase Details
Closed on
Dec 31, 2012
Sold by
Acorn Investment Associates Llc
Bought by
Nvr Inc
Create a Home Valuation Report for This Property
The Home Valuation Report is an in-depth analysis detailing your home's value as well as a comparison with similar homes in the area
Home Values in the Area
Average Home Value in this Area
Purchase History
| Date | Buyer | Sale Price | Title Company |
|---|---|---|---|
| Mcinemey Michael | $535,000 | None Available | |
| Kacchy Harsh | -- | None Available | |
| Kacchy Harsh | $446,000 | None Available | |
| Nvr Inc | $917,000 | None Available |
Source: Public Records
Mortgage History
| Date | Status | Borrower | Loan Amount |
|---|---|---|---|
| Open | Mcinemey Michael | $428,000 | |
| Previous Owner | Kacchy Harsh | $356,800 |
Source: Public Records
Tax History Compared to Growth
Tax History
| Year | Tax Paid | Tax Assessment Tax Assessment Total Assessment is a certain percentage of the fair market value that is determined by local assessors to be the total taxable value of land and additions on the property. | Land | Improvement |
|---|---|---|---|---|
| 2025 | $6,617 | $920,245 | $104,400 | $815,845 |
| 2024 | $6,617 | $630,561 | $90,000 | $540,561 |
| 2023 | $5,516 | $630,561 | $90,000 | $540,561 |
| 2022 | $5,062 | $630,561 | $90,000 | $540,561 |
| 2021 | $4,999 | $630,561 | $90,000 | $540,561 |
| 2020 | $4,189 | $522,429 | $77,250 | $445,179 |
| 2019 | $4,189 | $522,429 | $77,250 | $445,179 |
| 2018 | $3,944 | $522,429 | $77,250 | $445,179 |
| 2017 | $3,944 | $522,429 | $77,250 | $445,179 |
| 2016 | $3,767 | $494,247 | $75,000 | $419,247 |
| 2015 | $3,708 | $494,247 | $75,000 | $419,247 |
| 2014 | $4,515 | $618,437 | $75,000 | $543,437 |
| 2013 | -- | $67,500 | $67,500 | $0 |
Source: Public Records
Map
Nearby Homes
- 41 S Farnleigh Dr
- 50 Dover Ridge Ct
- 51 Dover Ridge Ct
- 51 Herndon Creek Way
- 79 Lystra Ridge Rd
- 286 Beech Slope Ct
- 64 W Beech Slope Ct
- 122 W Beech Slope Ct
- 139 Trillium Place
- 480 Beechmast
- 77004 Miller
- 499 Beechmast
- 74006 Harvey
- 309 Baneberry Close
- 348 N Village Pkwy
- 354 N Village Pkwy
- 10412 Stone
- 70007 Morehead
- 70011 Morehead
- 70009 Morehead
- 72 S Farnleigh Dr
- 72 S Farnleigh Dr Unit S
- 72 S Farnleigh Dr
- 55 Farnleigh Dr
- 95 Wood Laurel Ln
- 79 Farnleigh Dr
- 301 Farnleigh Dr
- 75 Wood Laurel Ln
- 104 S Farnleigh Dr
- 7 Wood Laurel Ln Unit 7
- 55 S Farnleigh Dr
- 111 Wood Laurel Ln
- 41 S Farnleigh Dr
- 67 S Farnleigh Dr
- 93 Farnleigh Dr
- 29 S Farnleigh Dr
- 317 S Farnleigh Dr
- 138 S Farnleigh Dr
- 138 S Farnleigh Dr Unit 174
- 129 Wood Laurel Ln