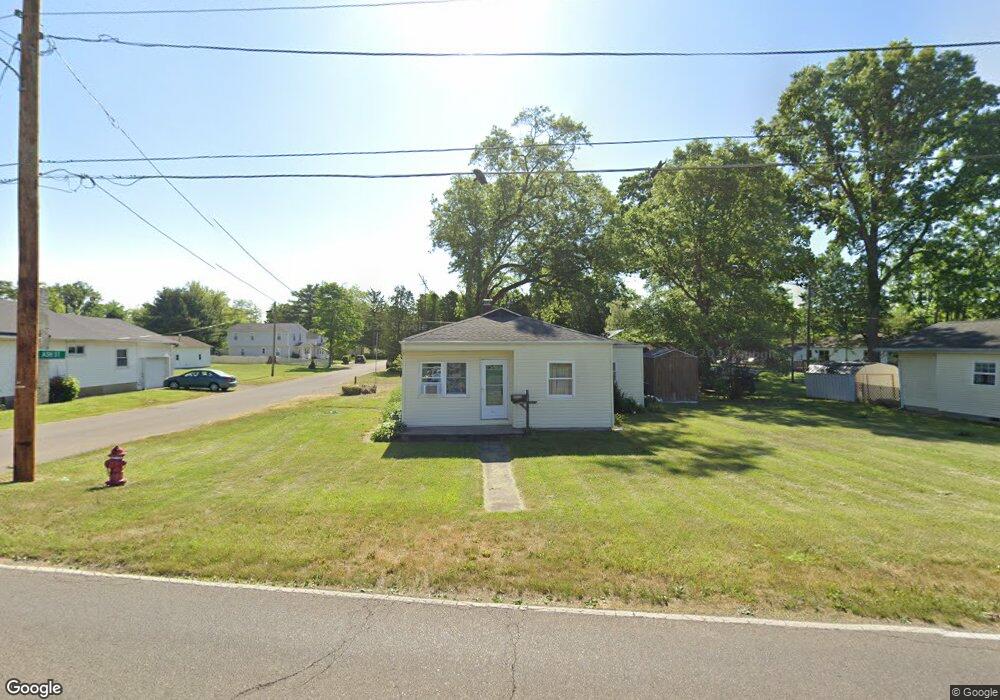
58 Sychar Rd Mount Vernon, OH 43050
Estimated Value: $92,000 - $187,000
3
Beds
1
Bath
1,164
Sq Ft
$136/Sq Ft
Est. Value
About This Home
This home is located at 58 Sychar Rd, Mount Vernon, OH 43050 and is currently estimated at $157,924, approximately $135 per square foot. 58 Sychar Rd is a home located in Knox County with nearby schools including Mount Vernon High School, St. Vincent de Paul School, and Mount Vernon Sda Elementary School.
Ownership History
Date
Name
Owned For
Owner Type
Purchase Details
Closed on
Jan 29, 2021
Sold by
Elswick Douglas W
Bought by
Valentine Donal
Current Estimated Value
Purchase Details
Closed on
Jun 5, 1996
Sold by
Metcalfe Thomas D and Ro An
Bought by
Schaaf Israel D and Schaaf Alesia
Purchase Details
Closed on
May 22, 1995
Sold by
Metcalfe Thomas D and Metcalfe Rosan
Bought by
Metcalfe Thomas D and Ro An
Purchase Details
Closed on
Oct 12, 1993
Bought by
Metcalfe Thomas D and Metcalfe Rosan
Purchase Details
Closed on
Aug 18, 1992
Sold by
Priest Kenneth W and Priest Helen
Bought by
Rural Housing Trust 1987-
Create a Home Valuation Report for This Property
The Home Valuation Report is an in-depth analysis detailing your home's value as well as a comparison with similar homes in the area
Home Values in the Area
Average Home Value in this Area
Purchase History
| Date | Buyer | Sale Price | Title Company |
|---|---|---|---|
| Valentine Donal | -- | None Available | |
| Schaaf Israel D | -- | -- | |
| Metcalfe Thomas D | -- | -- | |
| Metcalfe Thomas D | $12,600 | -- | |
| Rural Housing Trust 1987- | $15,700 | -- |
Source: Public Records
Tax History
| Year | Tax Paid | Tax Assessment Tax Assessment Total Assessment is a certain percentage of the fair market value that is determined by local assessors to be the total taxable value of land and additions on the property. | Land | Improvement |
|---|---|---|---|---|
| 2024 | $1,256 | $31,780 | $3,500 | $28,280 |
| 2023 | $1,234 | $31,780 | $3,500 | $28,280 |
| 2022 | $1,103 | $21,920 | $2,420 | $19,500 |
| 2021 | $955 | $21,920 | $2,420 | $19,500 |
| 2020 | $548 | $21,920 | $2,420 | $19,500 |
| 2019 | $683 | $24,080 | $2,610 | $21,470 |
| 2018 | $683 | $24,080 | $2,610 | $21,470 |
| 2017 | $671 | $24,080 | $2,610 | $21,470 |
| 2016 | $595 | $22,300 | $2,420 | $19,880 |
| 2015 | $597 | $22,300 | $2,420 | $19,880 |
| 2014 | $600 | $22,300 | $2,420 | $19,880 |
| 2013 | $648 | $22,610 | $2,270 | $20,340 |
Source: Public Records
Map
Nearby Homes
- 0 Miami St
- 14 Hilltop Dr
- 418 E Pleasant St
- 11 Highland Dr
- 332 Wooster Rd
- 108 Ringold St
- 220 Coshocton Ave
- 600 1/2 E Chestnut St
- 600 E Chestnut St Unit 1/2
- 208 E Burgess St
- 608 N Gay St
- 12 3rd Ave
- 12 Third Ave
- 6 Fairway Dr
- 501 Oak St
- 200 Eastwood Dr
- 304 N Gay St
- 203 S Center St
- 111 Potwin St
- 6 Edgewood Blvd
Your Personal Tour Guide
Ask me questions while you tour the home.