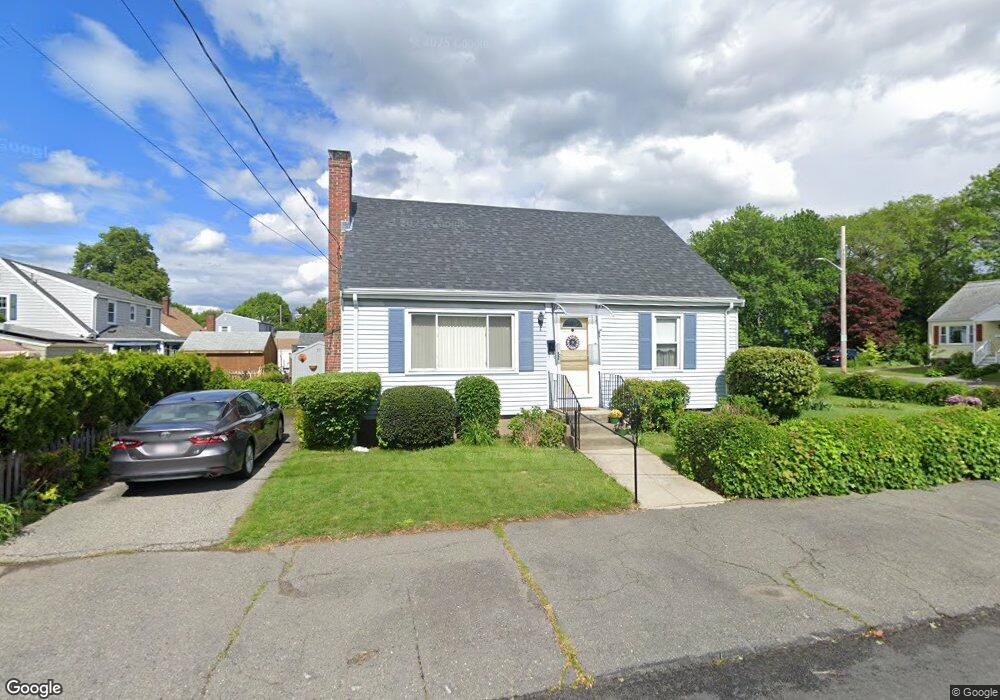
58 Thorpe Rd Lynn, MA 01905
Lower Boston Street NeighborhoodEstimated Value: $564,728 - $603,000
3
Beds
1
Bath
1,290
Sq Ft
$458/Sq Ft
Est. Value
About This Home
This home is located at 58 Thorpe Rd, Lynn, MA 01905 and is currently estimated at $591,182, approximately $458 per square foot. 58 Thorpe Rd is a home located in Essex County with nearby schools including Julia F. Callahan Elementary School, William R. Fallon School, and Breed Middle School.
Ownership History
Date
Name
Owned For
Owner Type
Purchase Details
Closed on
Sep 29, 2000
Sold by
Est Hartney C and Casey Joseph David
Bought by
Wladkowski Richard A and Wladkowski Janine C
Current Estimated Value
Home Financials for this Owner
Home Financials are based on the most recent Mortgage that was taken out on this home.
Original Mortgage
$105,000
Interest Rate
7.94%
Mortgage Type
Purchase Money Mortgage
Create a Home Valuation Report for This Property
The Home Valuation Report is an in-depth analysis detailing your home's value as well as a comparison with similar homes in the area
Home Values in the Area
Average Home Value in this Area
Purchase History
| Date | Buyer | Sale Price | Title Company |
|---|---|---|---|
| Wladkowski Richard A | $87,500 | -- | |
| Wladkowski Richard A | $87,500 | -- | |
| Wladkowski Richard A | $87,500 | -- |
Source: Public Records
Mortgage History
| Date | Status | Borrower | Loan Amount |
|---|---|---|---|
| Open | Wladkowski Richard A | $112,000 | |
| Closed | Wladkowski Richard A | $105,000 |
Source: Public Records
Tax History
| Year | Tax Paid | Tax Assessment Tax Assessment Total Assessment is a certain percentage of the fair market value that is determined by local assessors to be the total taxable value of land and additions on the property. | Land | Improvement |
|---|---|---|---|---|
| 2025 | $5,451 | $526,200 | $232,500 | $293,700 |
| 2024 | $4,998 | $474,600 | $204,300 | $270,300 |
| 2023 | $4,993 | $447,800 | $211,000 | $236,800 |
| 2022 | $4,660 | $374,900 | $156,200 | $218,700 |
| 2021 | $4,314 | $331,100 | $143,700 | $187,400 |
| 2020 | $4,216 | $314,600 | $138,300 | $176,300 |
| 2019 | $4,256 | $297,600 | $130,200 | $167,400 |
| 2018 | $4,340 | $286,500 | $143,700 | $142,800 |
| 2017 | $4,005 | $256,700 | $119,400 | $137,300 |
| 2016 | $3,896 | $240,800 | $111,800 | $129,000 |
| 2015 | $3,757 | $224,300 | $110,900 | $113,400 |
Source: Public Records
Map
Nearby Homes
- 590 Boston St Unit 303
- 46 Wilfred St
- 70 Wyman St
- 79 Laurel St
- 189 Holyoke St
- 32 Birch Brook Landing Unit 23
- 32 Birch Brook Landing Unit 25
- 32 Birch Brook Landing Unit 22
- 268 Walnut St
- 73 Waterhill St
- 32 Birch Brook Rd Unit 13
- 32 Birch Brook Rd Unit 27
- 32 Birch Brook Rd Unit 16
- 32 Birch Brook Rd Unit 1
- 32 Birch Brook Rd Unit 14
- 32 Birch Brook Rd Unit 28
- 11 Margin St Unit 7
- 78-80 Spencer St
- 20 Murray St
- 45 Cottage St Unit 3
Your Personal Tour Guide
Ask me questions while you tour the home.