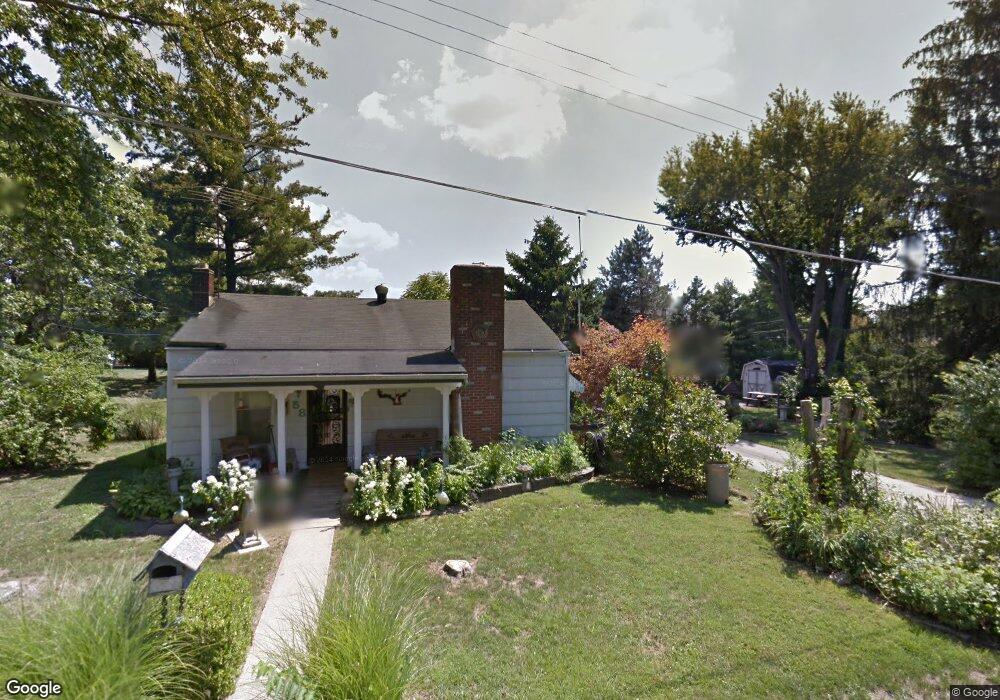
58 Vine St Delaware, OH 43015
Estimated Value: $187,000 - $243,716
3
Beds
2
Baths
1,092
Sq Ft
$190/Sq Ft
Est. Value
About This Home
This home is located at 58 Vine St, Delaware, OH 43015 and is currently estimated at $207,429, approximately $189 per square foot. 58 Vine St is a home located in Delaware County with nearby schools including James Conger Elementary School, John C. Dempsey Middle School, and Rutherford B. Hayes High School.
Ownership History
Date
Name
Owned For
Owner Type
Purchase Details
Closed on
Apr 5, 2024
Sold by
Morrow Timothy T and Morrow Kendra L
Bought by
Corl Kenny Scott
Current Estimated Value
Home Financials for this Owner
Home Financials are based on the most recent Mortgage that was taken out on this home.
Original Mortgage
$181,649
Outstanding Balance
$178,295
Interest Rate
6.94%
Mortgage Type
Credit Line Revolving
Estimated Equity
$29,134
Purchase Details
Closed on
Mar 25, 2024
Sold by
Morrow Timothy T and Morrow Kendra L
Bought by
Corl Kenny Scott
Home Financials for this Owner
Home Financials are based on the most recent Mortgage that was taken out on this home.
Original Mortgage
$181,649
Outstanding Balance
$178,295
Interest Rate
6.94%
Mortgage Type
Credit Line Revolving
Estimated Equity
$29,134
Purchase Details
Closed on
May 19, 2021
Sold by
Flahive Terrence P and Estate Of Donna M Duinn
Bought by
Morrow Timothy T and Morrow Kendra L
Purchase Details
Closed on
Apr 24, 2018
Bought by
Dunn Donna Mae
Create a Home Valuation Report for This Property
The Home Valuation Report is an in-depth analysis detailing your home's value as well as a comparison with similar homes in the area
Home Values in the Area
Average Home Value in this Area
Purchase History
| Date | Buyer | Sale Price | Title Company |
|---|---|---|---|
| Corl Kenny Scott | $185,000 | Liberty Title & Escrow | |
| Corl Kenny Scott | $185,000 | Liberty Title & Escrow | |
| Morrow Timothy T | $75,000 | Great American Title Agency | |
| Dunn Donna Mae | -- | -- |
Source: Public Records
Mortgage History
| Date | Status | Borrower | Loan Amount |
|---|---|---|---|
| Open | Corl Kenny Scott | $181,649 | |
| Closed | Corl Kenny Scott | $181,649 |
Source: Public Records
Tax History
| Year | Tax Paid | Tax Assessment Tax Assessment Total Assessment is a certain percentage of the fair market value that is determined by local assessors to be the total taxable value of land and additions on the property. | Land | Improvement |
|---|---|---|---|---|
| 2024 | $3,253 | $67,240 | $7,320 | $59,920 |
| 2023 | $2,959 | $61,050 | $7,320 | $53,730 |
| 2022 | $2,313 | $41,440 | $7,840 | $33,600 |
| 2021 | $2,364 | $41,440 | $7,840 | $33,600 |
| 2020 | $1,843 | $41,440 | $7,840 | $33,600 |
| 2019 | $1,485 | $32,620 | $6,160 | $26,460 |
| 2018 | $1,505 | $32,620 | $6,160 | $26,460 |
| 2017 | $1,491 | $28,040 | $5,780 | $22,260 |
| 2016 | $1,110 | $28,040 | $5,780 | $22,260 |
| 2015 | $1,116 | $28,040 | $5,780 | $22,260 |
| 2014 | $1,134 | $28,040 | $5,780 | $22,260 |
| 2013 | $1,194 | $28,950 | $5,780 | $23,170 |
Source: Public Records
Map
Nearby Homes
- 264 Hayes St
- 323 Via Condotti Viaduct
- 0 Dildine Rd Unit 225015764
- 210 E Central Ave
- 381 Rochdale Run
- 60 Oak St
- 401 Curve Rd
- 0 Fair Ave
- 102 Potter St
- 117 Wellesley Dr
- 111 Wellesley Dr
- 124 Wellesley Dr
- 118 Wellesley Dr
- 87 Wellesley Dr
- 69 Wellesley Dr
- 529 Rochdale Run
- 35 Chamberlain St
- 34 Prospect St
- 73 Allenhurst Way
- 55 Oldham Ln
Your Personal Tour Guide
Ask me questions while you tour the home.